Inclined Sections
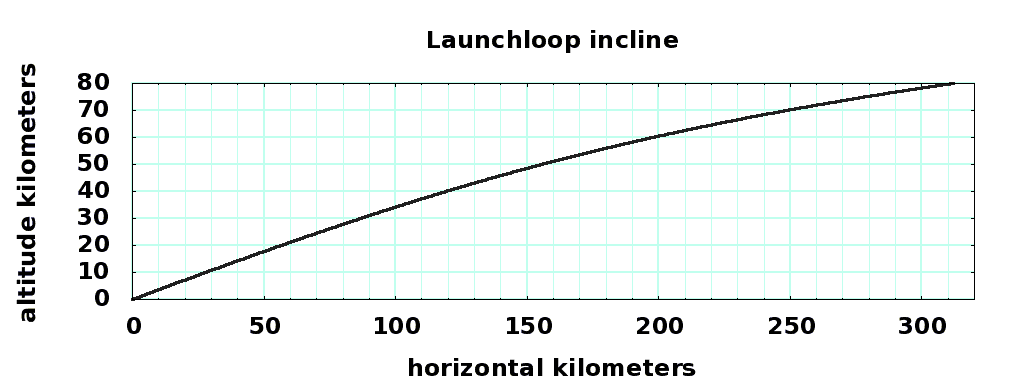
The inclines are the regions of the loop where the rotor rises from the surface to 80km launch altitude.
MORE LATER
parameter |
bottom value |
top value |
units |
horizontal distance |
0 |
311.9 |
kilometers |
vertical distance |
0 |
80 |
kilometers |
incline sheath mass |
10 |
10 |
kg/m |
cable angle |
38.85 |
- |
degrees |
cable offset |
20.0 |
- |
kilometers |
cable support length |
80.0 |
80 |
kilometers |
incline slope |
0.3640 |
0.1400 |
vert/horiz |
incline angle |
20.00 |
8.01 |
degrees |
deflection force |
205,016 |
82,093 |
kiloNewtons |
deflection force vertical |
201,902 |
81,893 |
kiloNewtons |
deflection force horizontal |
35,601 |
5,731 |
kiloNewtons |
rotor mass density |
2.9882 |
3.0000 |
kg/meter |
rotor velocity |
14,055 |
14,000 |
meter/sec |
gravity |
9.81 |
9.57 |
meter2/sec |
cable force ratio gz |
1.14 |
4.73 |
vert/horiz |
cable axial force |
- |
27,701 |
kiloNewtons/rotor |
station support force |
- |
54,792 |
kiloNewtons/rotor |
station + elevator mass |
- |
5726 |
metric tons/rotor |
main diagonal cable mass |
- |
2150 |
metric tons/rotor |
incline cable mass |
- |
1280 |
metric tons/rotor |
The forces and masses are per rotor pass. The rotor passes each station twice at altitude, eastbound and westbound, so the forces and masses double. For example, the station mass can be 11452 metric tons. The eastbound rotor passes above the westbound rotor by many hundreds of meters, so the main station support column will be at least that tall.

source. gnuplot control file You will need http://gnuplot.info to make the plot, though you can output the data to other plotting packages.
