|
Size: 2851
Comment:
|
Size: 7316
Comment:
|
| Deletions are marked like this. | Additions are marked like this. |
| Line 6: | Line 6: |
| Useful graphs for Apollo 8, 10, and 11. I cannot find useful entry information after Apollo 11, so these three sets are hopefully representative of the other six lunar missions. The command module had roll and attitude thrusters, which were used to indirectly control the trajectory. The center-of-mass of the command module was offset toward's the astronaut's feet. That edge of the CM would lead into the airstream; the capsule could be rotated with the roll thrusters so that the lift vector (directed towards the nose) vectored the spacecraft left, right, up, or down. The lift-to-drag ratio for the CM was approximately 0.3, so if the entry drag was near maximum at 6 gees, the lift vector would be about 2 gees, pointed whichever way was necessary to adjust the trajectory. Coming in above orbital velocity, the lift vector would be pointed earthward to keep the CM at the right altitude; below "Vcirc" the lift vector was pointed up to maintain altitude (and thus density and drag force). The "entry scroll" is a paper graph that was preloaded into the [[ http://nassp.sourceforge.net/wiki/Entry_Monitoring_System | Entry Monitoring System]], and scrolled past a little window in the control panel between the left and center seats. If the computer failed, the command module pilot adjusted the roll and lift of the command module to follow the graph. There were two graphs, skip and no skip; if weather over the primary recovery site was bad, the computer (or the CMP manually) would select the "skip" graph and extend reentry by a few hundred kilometers. Apollo 11 skipped to avoid a thunderstorm, the other missions did not skip, and landed at the primary recovery site. Apollo 16 was the '''highest gee reentry.''' ''I wonder why???''' == Click pictures for enlargements == ------- |
|
| Line 9: | Line 19: |
| . Entry at 400 kft (122 km) at 146:46:12.8 | . Entry at 400 kft (122 km) at 146:46:12.8 . velocity 36 221 ft/s ( 11 040 m/s) . flight path angle -6.50 degrees, ( 0.114 slope ) . maximum velocity 36 303 ( 11 065 m/s ) . maximum acceleration 6.84 gees |
| Line 11: | Line 26: |
| ==== Roll ==== {{attachment:a8r.png}} ==== Entry Monitor System Scroll ==== {{attachment:a8a.png}} {{attachment:a8b.png}} |
=== Entry Monitor System Scroll, Gees vs Velocity === [[ attachment:a8a.png | {{attachment:a8a.png | | width=400}} ]] [[ attachment:a8b.png | {{attachment:a8b.png | | width=280}} ]] === Roll vs Mission Elapsed Time === [[ attachment:a8r.png | {{attachment:a8r.png | | width=400}} ]] ------- |
| Line 19: | Line 37: |
| . Entry at 400 kft (122 km) at 191:48:54.5 ==== Entry Monitor System Scroll ==== {{attachment:a10.png}} |
. Entry at 400 kft (122 km) at 191:48:54.5 . velocity 36 314 ft/sec (11 068 m/s) . flight-path angle -6.54 degrees ( slope 0.115 ) . maximum velocity 36 397 ft/s ( 11 094 m/s) . maximum acceleration 6.78 gees . [[ http://history.nasa.gov/ap10fj/pdf/19730064165_a10mr-supp10-entry-postflight-analysis.pdf | Entry Postflight Analysis ]] === Entry Monitor System Scroll, Gees vs velocity === [[ attachment:a10ems.png | {{attachment:a10ems.png | | width=800 }} ]] === Roll and Altitude vs Ground Elapsed Time === [[ attachment:a10roll.png | {{ attachment:a10roll.png | | width=350 }} ]] [[ attachment:a10alt.png | {{ attachment:a10alt.png | | width=350 }} ]] === Gees and Lift/Drag vs Ground Elapsed Time === [[ attachment:a10gee.png | {{ attachment:a10gee.png | | width=350 }} ]] [[ attachment:a10LD.png | {{ attachment:a10LD.png | | width=350 }} ]] === Range and Vertical Velocity vs Ground Elapsed Time === [[ attachment:a10range.png | {{attachment:a10range.png | | width=350 }} ]] [[ attachment:a10rdot.png | {{attachment:a10rdot.png | | width=350 }} ]] ------- |
| Line 25: | Line 64: |
| . Entry at 400 kft (122 km) at 195:03:05.7 | . Entry at 400 kft (122 km) at 195:03:05.7 . velocity 36 194.4 ft/sec (11 032 m/s) . flight-path angle -6.48 degrees ( slope 0.114 ) . maximum velocity 36 227.4 ft/s ( 11 042 m/s) . maximum acceleration 6.51 gees |
| Line 30: | Line 74: |
| . Table III | == Table III == |
| Line 38: | Line 83: |
| {{attachment:a11LD.png}} | |
| Line 40: | Line 84: |
| === Entry Monitor System Scroll, Gees vs Velocity === [[ attachment:a11ems.png | {{ attachment:a11ems.png | | width=800 }} ]] |
|
| Line 41: | Line 87: |
| === Roll and Altitude vs Time from Entry Interface === [[ attachment:a11roll.png | {{ attachment:a11roll.png | | width=440 }} ]] [[ attachment:a11alt.png | {{ attachment:a11alt.png | | width=260 }} ]] |
|
| Line 42: | Line 91: |
| === Gees vs Time from Entry Interface and Lift/Drag vs Mach Number (velocity) === [[ attachment:a11gee.png | {{ attachment:a11gee.png | | width=300 }} ]] [[ attachment:a11LD.png | {{ attachment:a11LD.png | | width=400 }} ]] === Range and Vertical Velocity vs Time from Entry Interface === [[ attachment:a11range.png | {{ attachment:a11range.png | | width=290 }} ]] [[ attachment:a11RDOT.png | {{ attachment:a11RDOT.png | | width=410 }} ]] === Velocity vs Time from Entry Interface === [[ attachment:a11vel.png | {{ attachment:a11vel.png | | width=400 }} ]] ------- |
|
| Line 44: | Line 104: |
| . page 5-14 98/310 TABLE 5-IX . - ENTRY TRAJECTORY PARAMETERS . Entry at 400 kft (122 km) at 244:22:19.1 ==== No Entry Monitor System Scroll, sigh ==== == Apollo 13 == . [[ https://www.hq.nasa.gov/alsj/a13/A13_MissionReport.pdf | Mission report ]] ==== No Entry information, sigh ==== == Apollo 14 == . [[ https://www.hq.nasa.gov/alsj/a14/A14MRntrs.pdf | Mission report ]] . page . Entry at 400 kft (122 km) at == Apollo 15 == . [[ https://www.hq.nasa.gov/alsj/a15/ap15mr.pdf | Mission report ]] . page . Entry at 400 kft (122 km) at == Apollo 16 == . [[ https://www.hq.nasa.gov/alsj/a16/A16_MissionReport.pdf | Mission report ]] . page . Entry at 400 kft (122 km) at == Apollo 17 == . [[ https://www.hq.nasa.gov/alsj/a17/A17_MissionReport.pdf | Mission report ]] . page . Entry at 400 kft (122 km) at |
. page 5-14 96/310 TABLE 5-IX . - ENTRY TRAJECTORY PARAMETERS . Entry at 400 kft (122 km) at 244:22:19.1 . velocity 36 116 ft/sec (11 008 m/s) . flight-path angle -6.48 degrees ( slope 0.108 ) ------- '''~+ Apollo 13 +~''' [[ https://www.hq.nasa.gov/alsj/a13/A13_MissionReport.pdf | Mission report ]] page 9-17, two brief paragraphs about entry and landing (useless) '''~+ Apollo 14 +~''' [[ https://www.hq.nasa.gov/alsj/a14/A14MRntrs.pdf | Mission report ]] page 5-28, two brief paragraphs about entry and landing (useless) '''~+ Apollo 15 +~''' [[ https://www.hq.nasa.gov/alsj/a15/ap15mr.pdf | Mission report ]] page 114, two brief paragraphs about entry and landing (useless) '''~+ Apollo 16 +~''' [[ https://www.hq.nasa.gov/alsj/a16/A16_MissionReport.pdf | Mission report ]] page 9-56, "entry deceleration exceeded 7 gees" (semi-useless) '''~+ Apollo 17 +~''' [[ https://www.hq.nasa.gov/alsj/a17/A17_MissionReport.pdf | Mission report ]] page 190, no trajectory data (useless) |
Apollo Entry
From Apollo mission reports here
Apollo 7 and 9 were earth orbit, slower reentry. Apollo 8 and 10 through 17 were lunar missions with high speed reentry of the command module. Apollo 11,12, and 14-17 were landing missions.
Useful graphs for Apollo 8, 10, and 11. I cannot find useful entry information after Apollo 11, so these three sets are hopefully representative of the other six lunar missions.
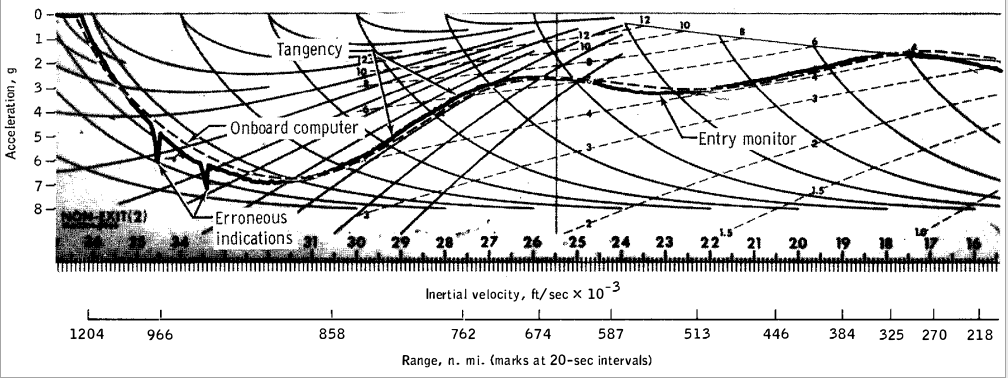
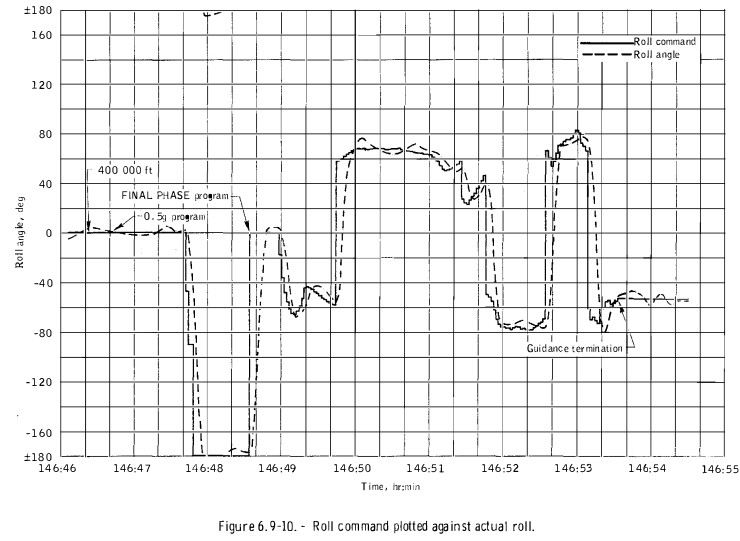
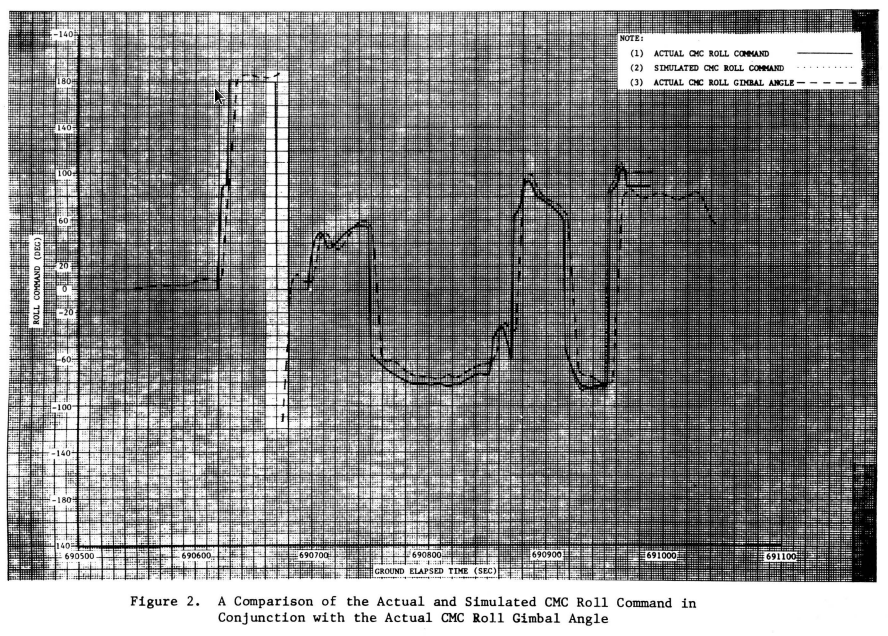
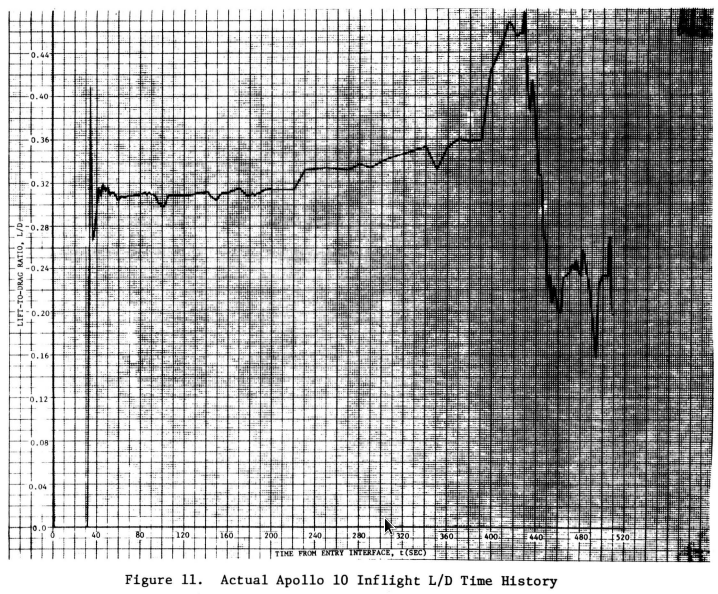
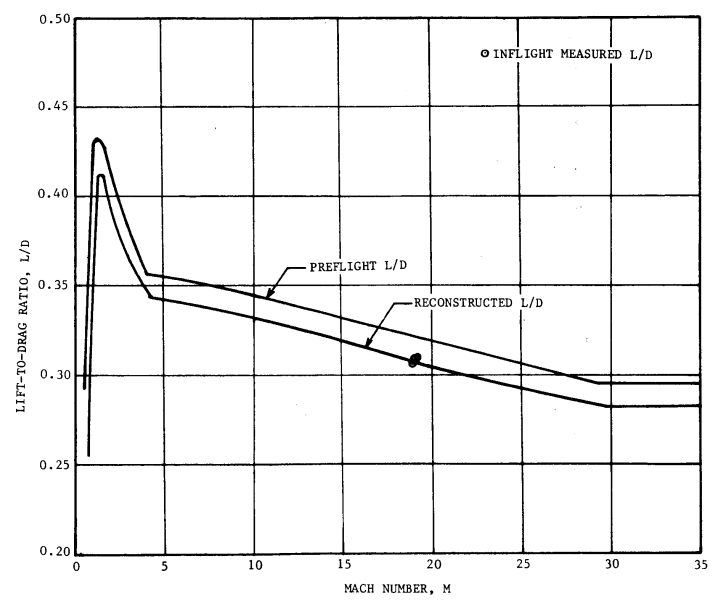
The command module had roll and attitude thrusters, which were used to indirectly control the trajectory. The center-of-mass of the command module was offset toward's the astronaut's feet. That edge of the CM would lead into the airstream; the capsule could be rotated with the roll thrusters so that the lift vector (directed towards the nose) vectored the spacecraft left, right, up, or down. The lift-to-drag ratio for the CM was approximately 0.3, so if the entry drag was near maximum at 6 gees, the lift vector would be about 2 gees, pointed whichever way was necessary to adjust the trajectory. Coming in above orbital velocity, the lift vector would be pointed earthward to keep the CM at the right altitude; below "Vcirc" the lift vector was pointed up to maintain altitude (and thus density and drag force).
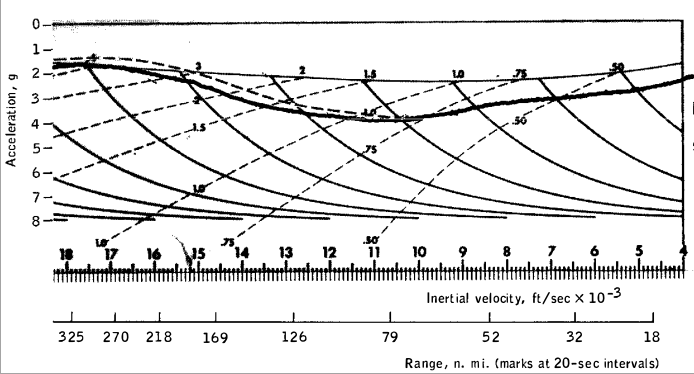
The "entry scroll" is a paper graph that was preloaded into the Entry Monitoring System, and scrolled past a little window in the control panel between the left and center seats. If the computer failed, the command module pilot adjusted the roll and lift of the command module to follow the graph. There were two graphs, skip and no skip; if weather over the primary recovery site was bad, the computer (or the CMP manually) would select the "skip" graph and extend reentry by a few hundred kilometers. Apollo 11 skipped to avoid a thunderstorm, the other missions did not skip, and landed at the primary recovery site.
Apollo 16 was the highest gee reentry. I wonder why???
EI time Load g V f/s range n mi ° Bank Rdot f/s 0:00 0.000 36190 1593 0:28 0.049 36276 1418 0:30 36277 0.0 -3186 1:18 -666 1:30 30176 54.43 211 1:56 1.057 22091 -86.68
Click pictures for enlargements
Apollo 8
Entry Monitor System Scroll, Gees vs Velocity
Roll vs Mission Elapsed Time
Apollo 10
Entry Monitor System Scroll, Gees vs velocity
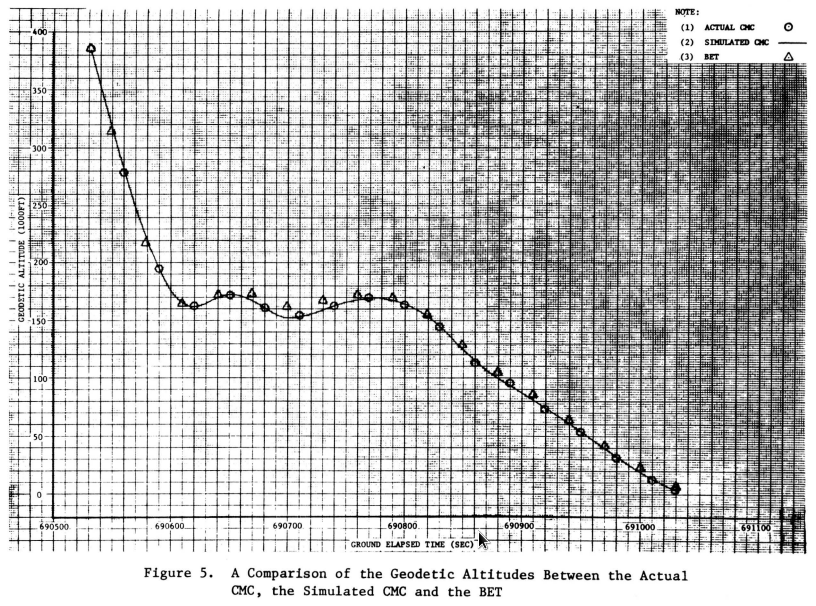
Roll and Altitude vs Ground Elapsed Time
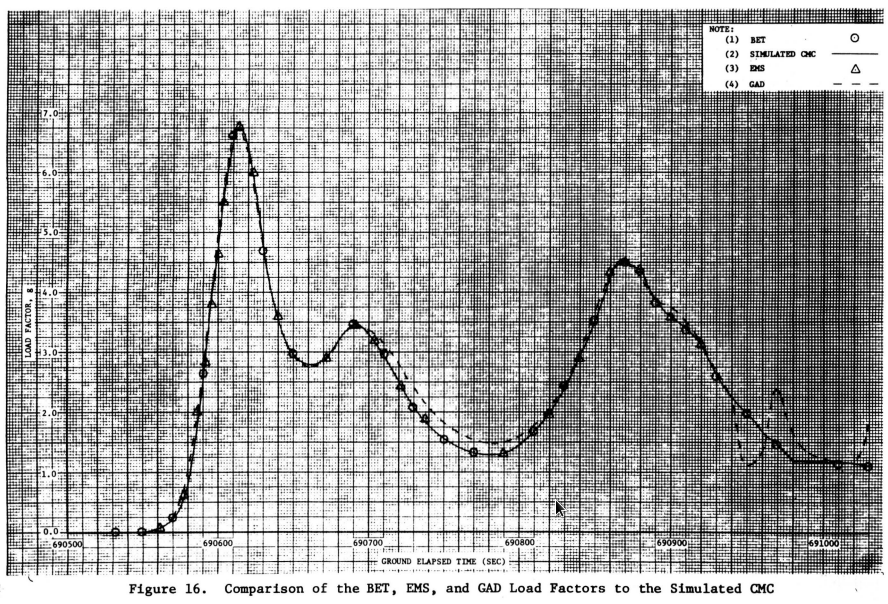
Gees and Lift/Drag vs Ground Elapsed Time
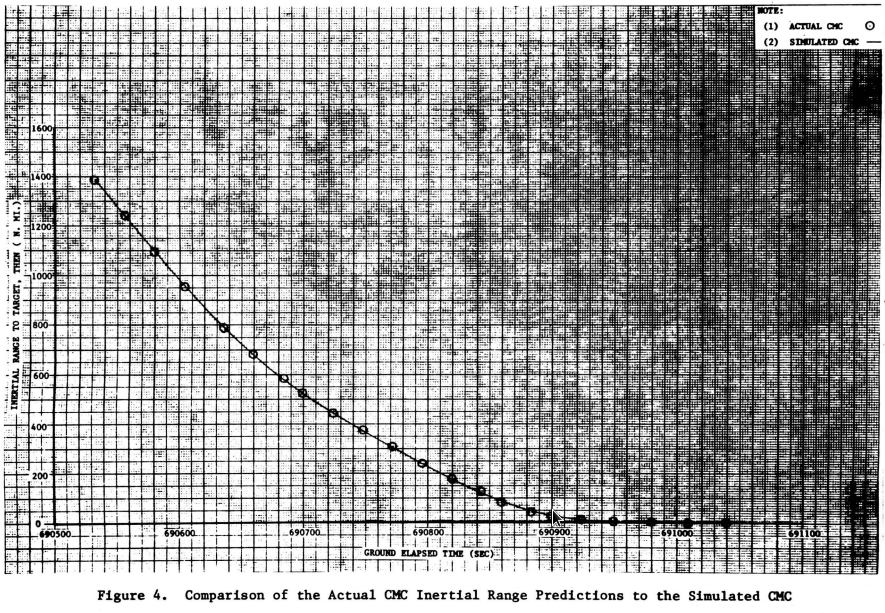
Range and Vertical Velocity vs Ground Elapsed Time
Apollo 11
Table III
Entry Monitor System Scroll, Gees vs Velocity
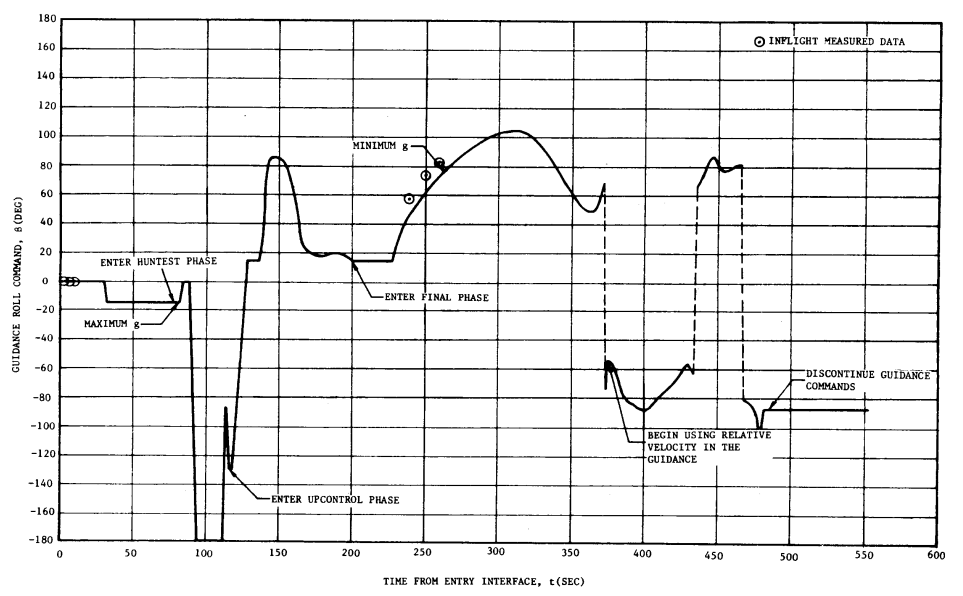
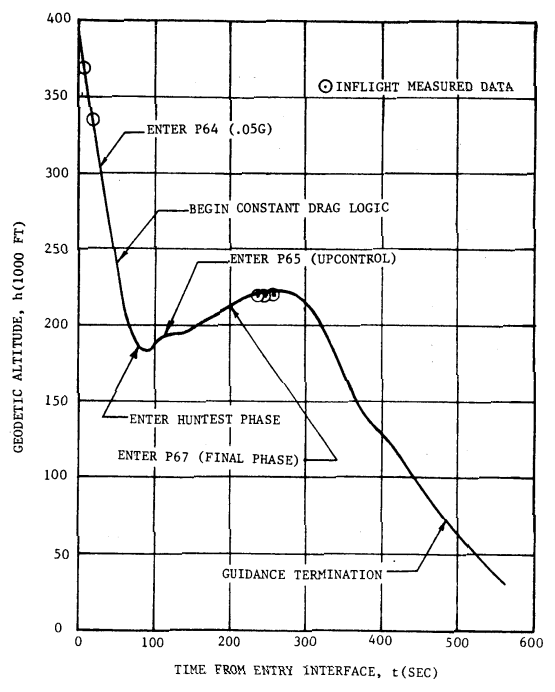
Roll and Altitude vs Time from Entry Interface
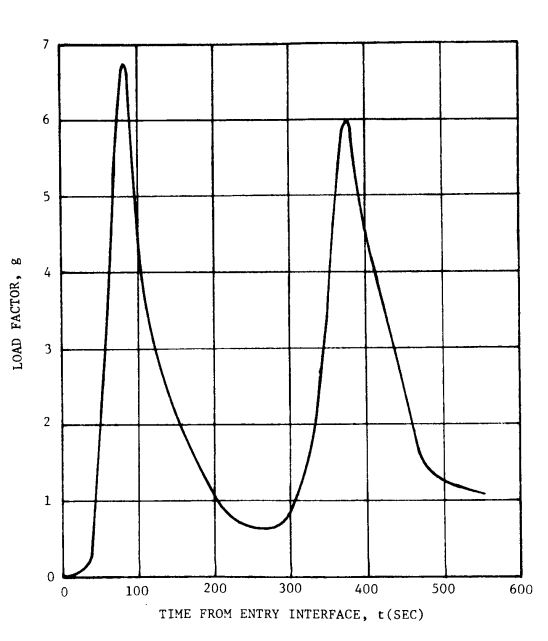
Gees vs Time from Entry Interface and Lift/Drag vs Mach Number (velocity)
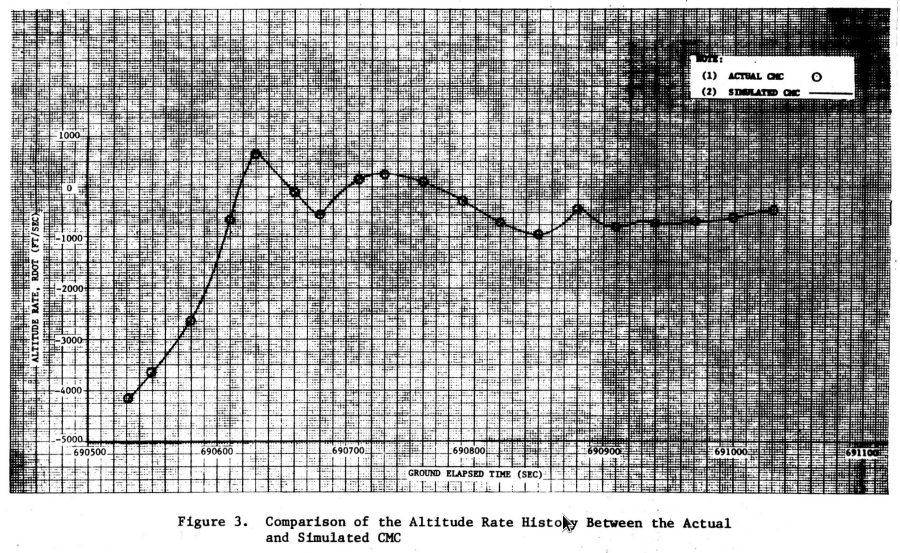
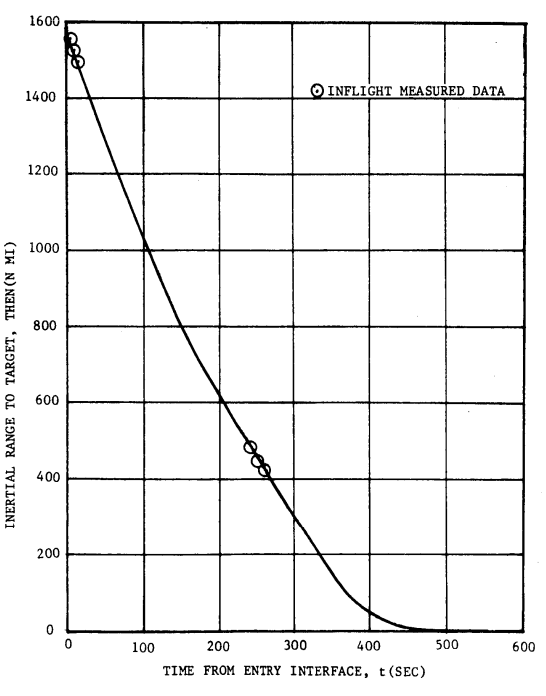
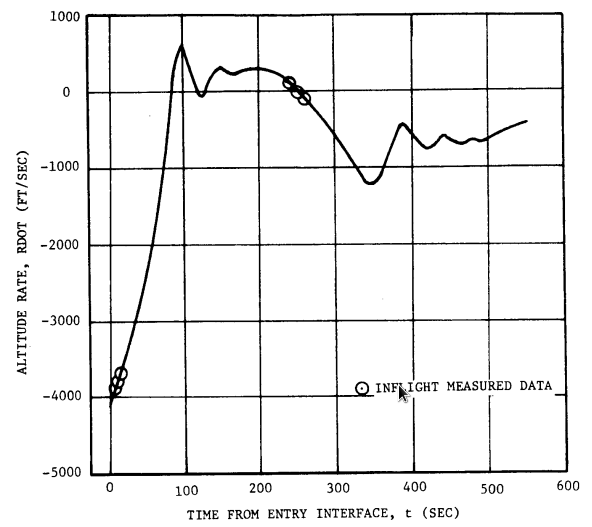
Range and Vertical Velocity vs Time from Entry Interface
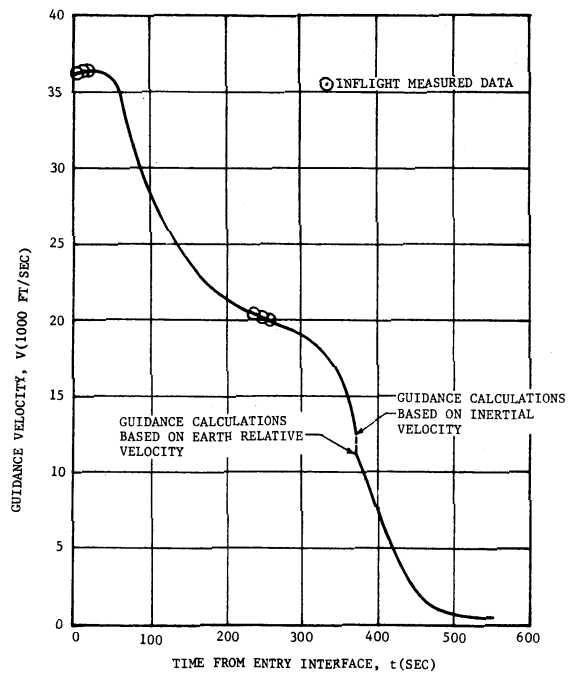
Velocity vs Time from Entry Interface
Apollo 12

