Apollo Entry
From Apollo mission reports here
Apollo 7 and 9 were earth orbit, slower reentry. Apollo 8 and 10 through 17 were lunar missions with high speed reentry of the command module. Apollo 11,12, and 14-17 were landing missions.
Useful graphs for Apollo 8, 10, and 11. I cannot find useful entry information after Apollo 11, so these three sets are hopefully representative of the other six lunar missions.
The command module had roll and attitude thrusters, which were used to indirectly control the trajectory. The center-of-mass of the command module was offset toward's the astronaut's feet. That edge of the CM would lead into the air stream; the capsule could be rotated with the roll thrusters so that the lift vector (directed towards the nose) vectored the spacecraft left, right, up, or down. The lift-to-drag ratio for the CM was approximately 0.3, so if the entry drag was near maximum at 6 gees, the lift vector would be about 2 gees, pointed whichever way was necessary to adjust the trajectory. Coming in above orbital velocity, the lift vector would be pointed earthward to keep the CM at the right altitude; below "Vcirc" the lift vector was pointed up to maintain altitude (and thus density and drag force).
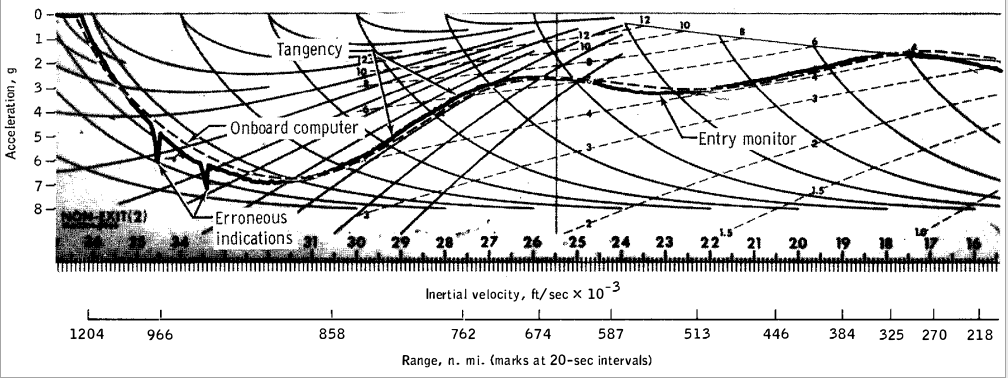
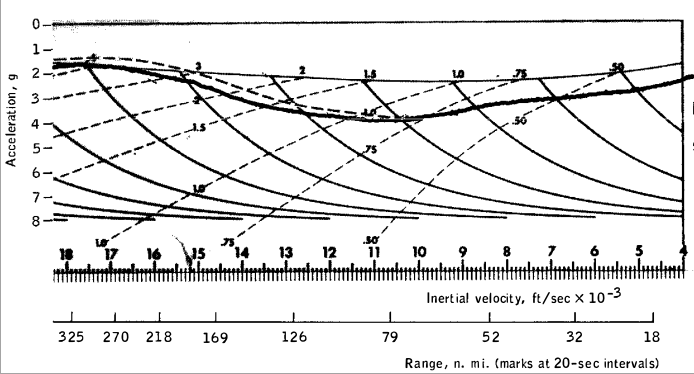
The "entry scroll" is a paper graph that was preloaded into the Entry Monitoring System, and scrolled past a little window in the control panel between the left and center seats. If the computer failed, the command module pilot adjusted the roll and lift of the command module to follow the graph. There were two graphs, skip and no skip; if weather over the primary recovery site was bad, the computer (or the CMP manually) would select the "skip" graph and extend reentry by a few hundred kilometers. Apollo 11 skipped to avoid a storm, the other missions did not skip, and landed at the primary recovery site.
Except ... it looks like Apollo 16 DID do a skip, see below:
Click pictures for enlargements
Apollo 8
- page 5-10, 53/252 TABLE 5-V . - ENTRY TRAJECTORY PARAMETERS
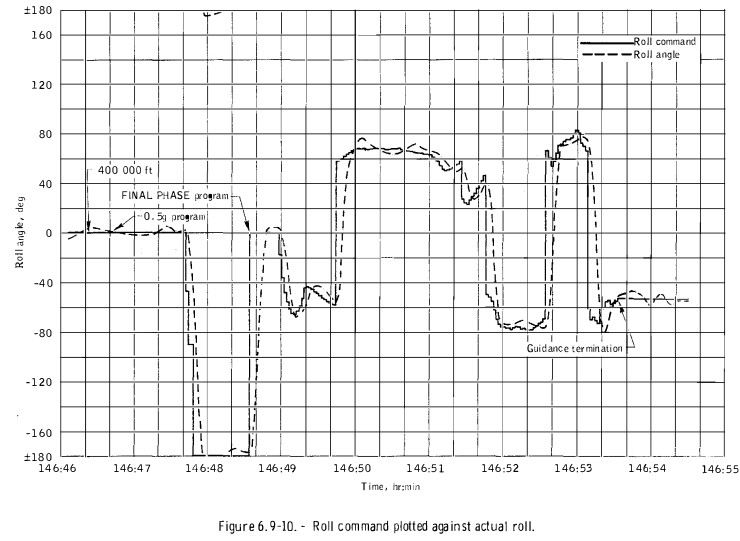
- Entry at 400 kft (122 km) at 146:46:12.8
- velocity 36 221 ft/s ( 11 040 m/s)
- flight path angle -6.50 degrees, ( 0.114 slope )
- maximum velocity 36 303 ( 11 065 m/s )
- maximum acceleration 6.84 gees
- page 6-67 to 6-69 entry graphs
Entry Monitor System Scroll, Gees vs Velocity
Roll vs Mission Elapsed Time
Apollo 10
- page 6-13, 54/323 TABLE 6-VI I . - ENTRY TRAJECTORY PARAMETERS
- Entry at 400 kft (122 km) at 191:48:54.5
- velocity 36 314 ft/sec (11 068 m/s)
- flight-path angle -6.54 degrees ( slope 0.115 )
- maximum velocity 36 397 ft/s ( 11 094 m/s)
- maximum acceleration 6.78 gees
Entry Monitor System Scroll, Gees vs velocity
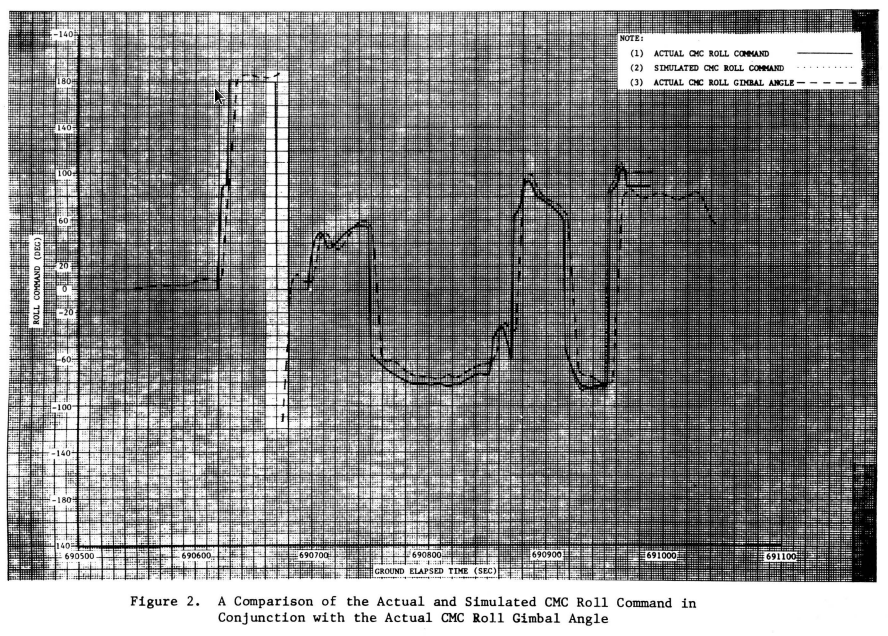
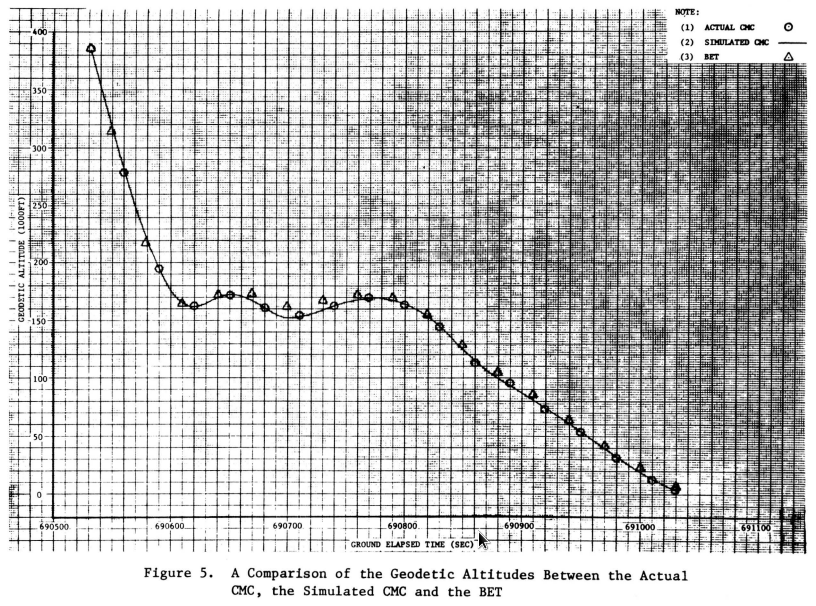
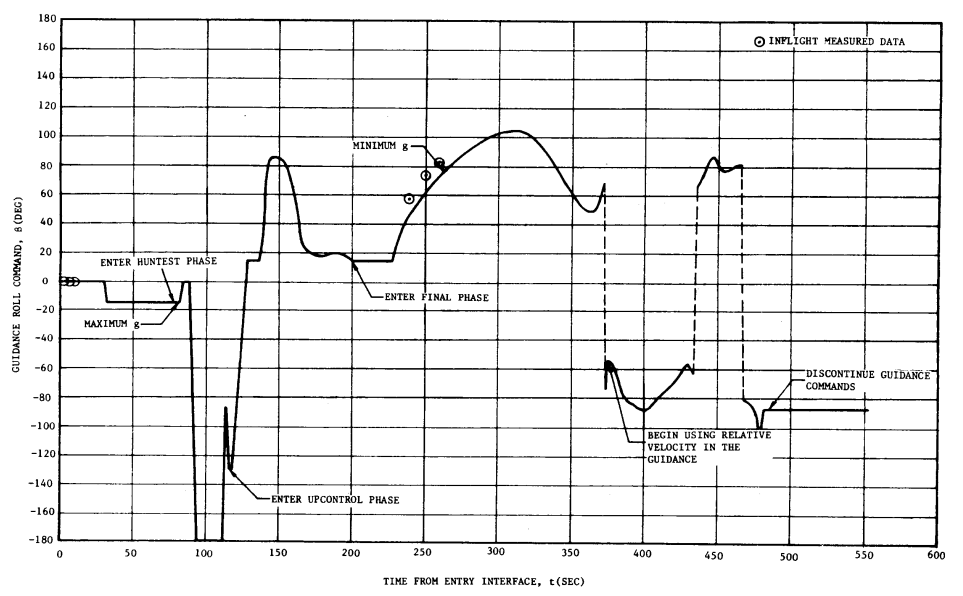
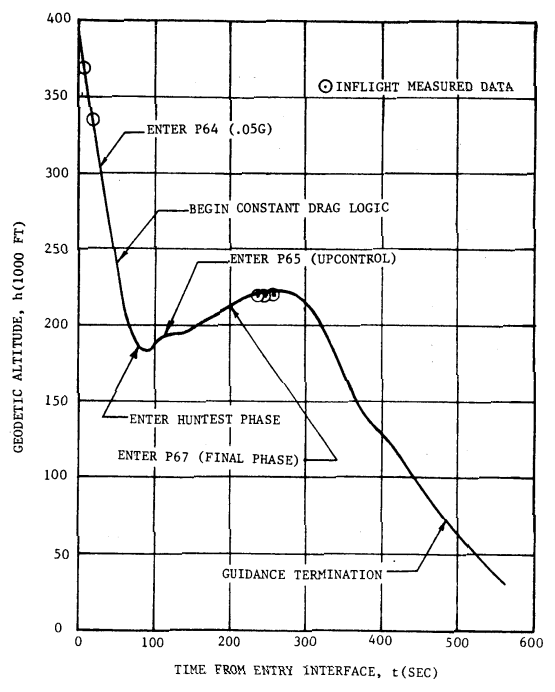
Roll and Altitude vs Ground Elapsed Time
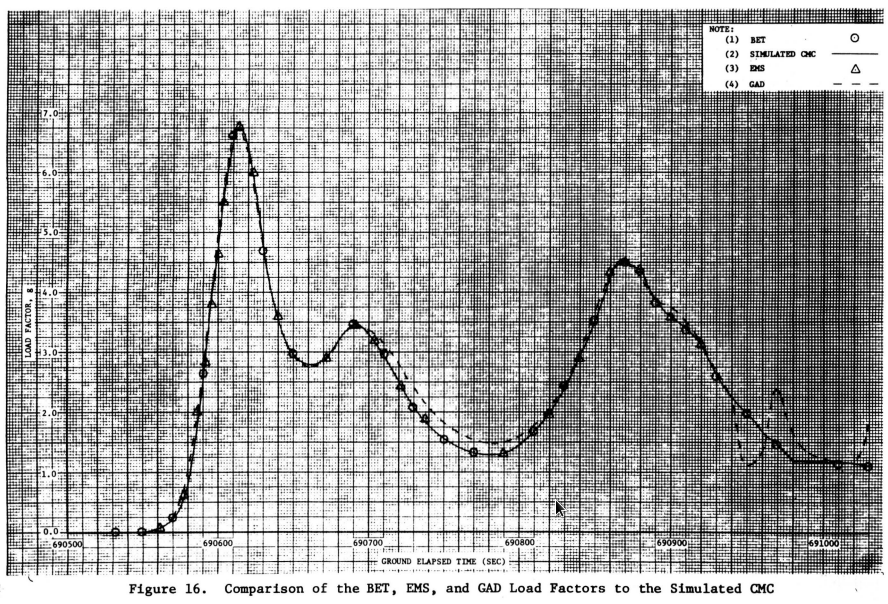
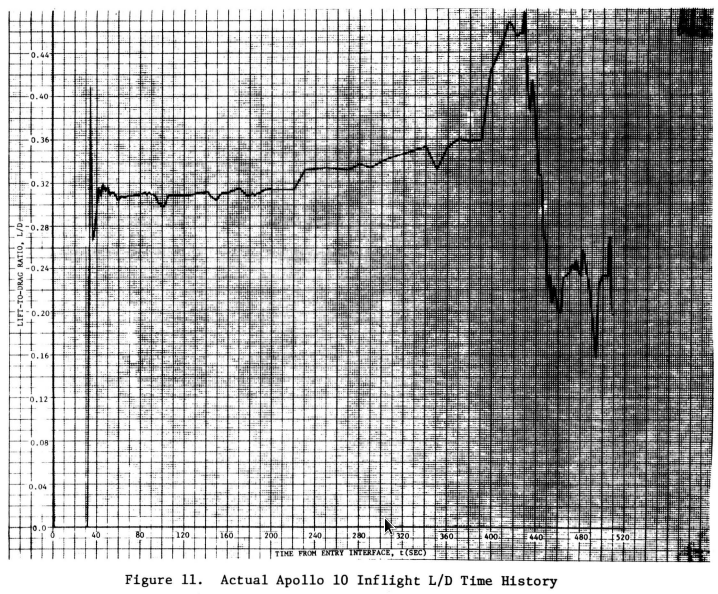
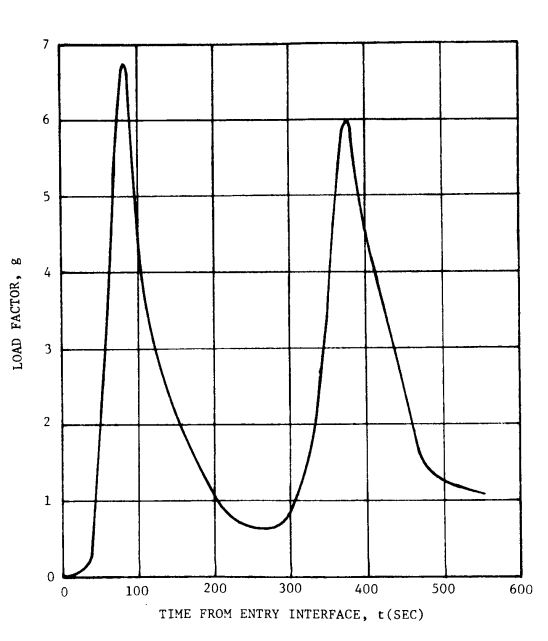
Gees and Lift/Drag vs Ground Elapsed Time
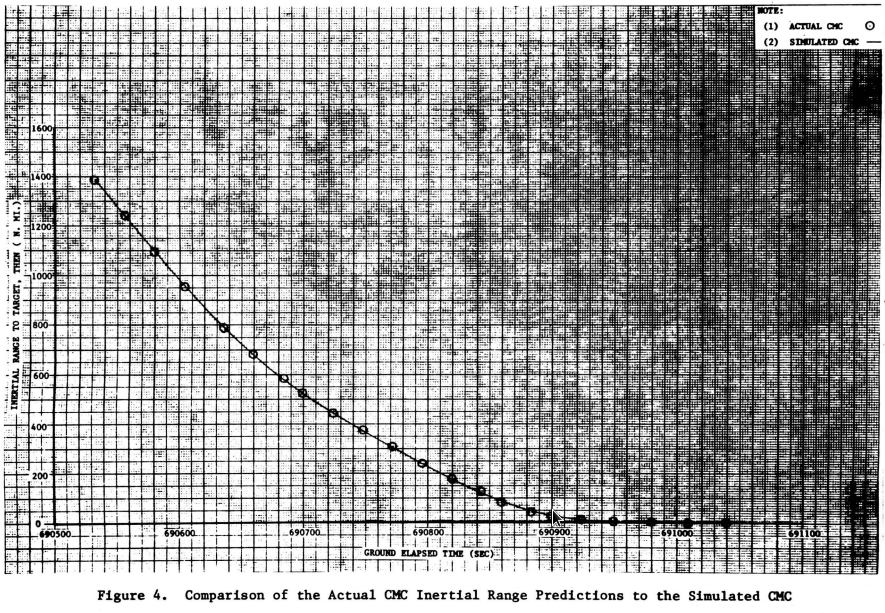
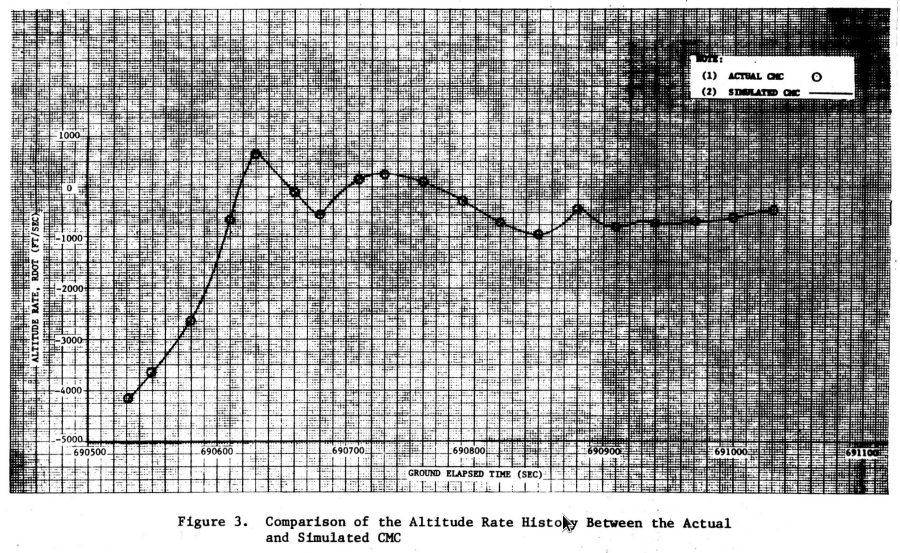
Range and Vertical Velocity vs Ground Elapsed Time
Apollo 11
- page 7-12 120/359 TABLE 7-VI I . - ENTRY TRAJECTORY PARAMETERS
- Entry at 400 kft (122 km) at 195:03:05.7
- velocity 36 194.4 ft/sec (11 032 m/s)
- flight-path angle -6.48 degrees ( slope 0.114 )
- maximum velocity 36 227.4 ft/s ( 11 042 m/s)
- maximum acceleration 6.51 gees
- 1st maximum load factor 6.73g 31,810ft/s
- 1st minimum load factor 0.48g 20,500ft/s
- 2nd maximum load factor 6.00g 12,390ft/s
Table III
EI time |
Load g |
V f/s |
range n mi |
° Bank |
Rdot f/s |
0:00 |
0.000 |
36190 |
1593 |
|
|
0:28 |
0.049 |
36276 |
1418 |
|
|
0:30 |
|
36277 |
|
0.0 |
-3186 |
1:18 |
|
|
|
|
-666 |
1:30 |
|
30176 |
|
54.43 |
211 |
1:56 |
1.057 |
22091 |
|
-86.68 |
|
Entry Monitor System Scroll, Gees vs Velocity
Roll and Altitude vs Time from Entry Interface
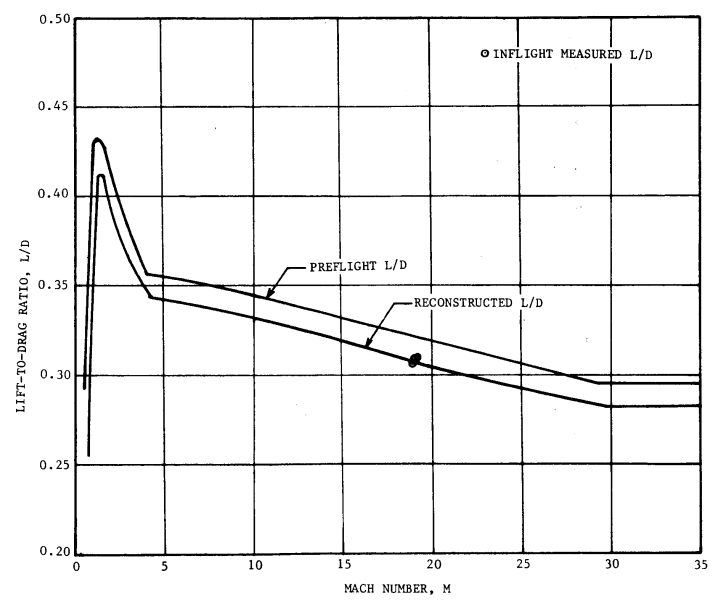
Gees vs Time from Entry Interface and Lift/Drag vs Mach Number (velocity)
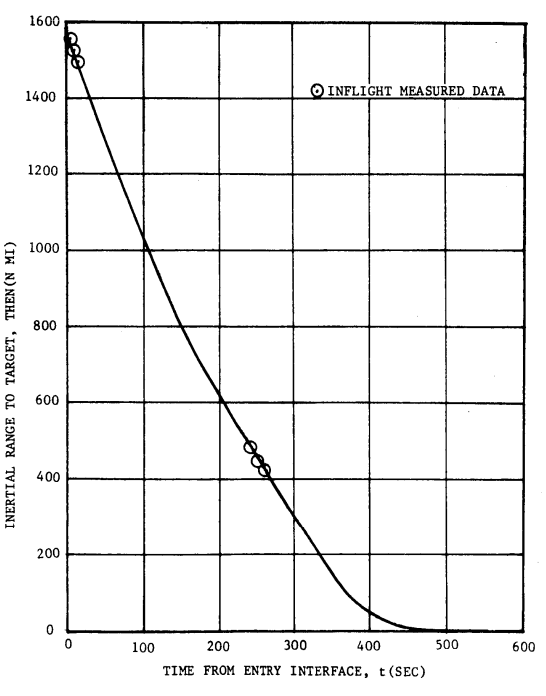
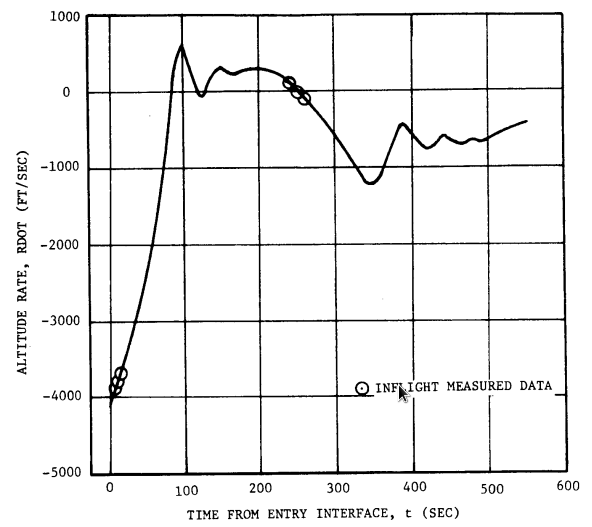
Range and Vertical Velocity vs Time from Entry Interface
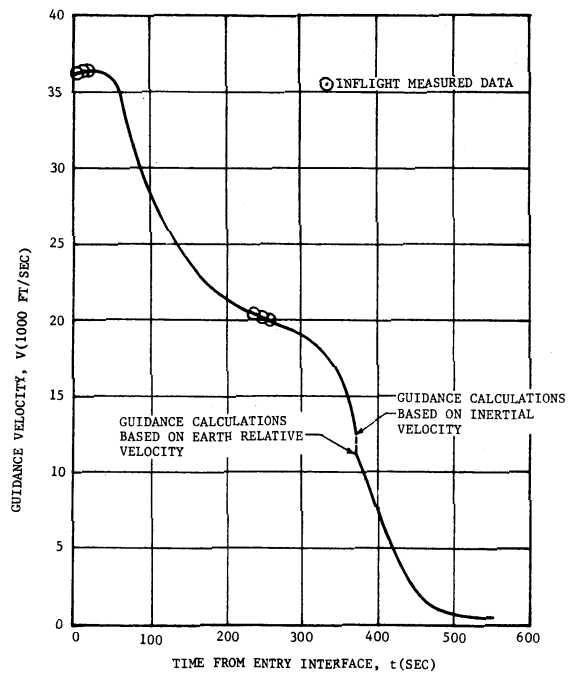
Velocity vs Time from Entry Interface
Apollo 12
- page 5-14 96/310 TABLE 5-IX . - ENTRY TRAJECTORY PARAMETERS
- Entry at 400 kft (122 km) at 244:22:19.1
- velocity 36 116 ft/sec (11 008 m/s)
- flight-path angle -6.48 degrees ( slope 0.108 )
Apollo 13 Mission report page 9-17, two brief paragraphs about entry and landing (useless)
Apollo 14 Mission report page 5-28, two brief paragraphs about entry and landing (useless)
Apollo 15 Mission report page 114, two brief paragraphs about entry and landing (useless)
Apollo 16 Mission report page 9-56, "entry deceleration exceeded 7 gees" (semi-useless)
Apollo 16 was the highest gee reentry.I wonder why??? According to the flight journal,
PAO = Public Affairs Officer:
- PAO: ... We show a velocity at time of Entry into the Earth's atmosphere for Apollo 16 at 36,276 feet per second. This is predicted. And a max g on the crew of Apollo 16 during entry of 7.07 Gs. We're at 289 hours, 29 minutes [264:42].
264:47:35 Duke: Okay, with the readback, Hank. MidPac; 000, 153, 000; 290:06:31, 267; minus 00.71, minus 156.18; 07.1; 36196, 6.54; 1051.0, 36276; 290:23:31; 00:27; Noun 69 is NA; 4.00, 02:00; 00:16, 03:31, 07:46; sextant and boresight are NA; lift vector is up. All the comments are the same except RET 90K is 6 plus 08 over.
MidPac mid-Pacific landing
000, 153, 000 roll, pitch, and yaw at the 0.05g event
290:06:31 time for CMP to perform horizon check
267 pitch angle of Earth horizon compared to calibration marks on the CMP left window, +/- 5 degrees
minus 00.71 entry point, degrees latitude (south of equator)
minus 156.18 entry point, degrees longitude (west of equator)
07.1 maximum gees
36196 entry velocity ft/s (at 400k ft, RET)
6.54 entry angle (at 400k ft)
1051.0 nautical miles from entry (at 0.05 gee) to landing
36276 entry velocity ft/s (at 0.05 gee)
290:23:31 estimated RET reentry time
00:27 seconds from RET to 0.05 gee
4.00 gees during contant g-force maintenance period
2.00 vcirc at 2 minutes 0 seconds after entry interface RET
00:16 RET beginning of blackout
03:31 RET end of blackout
07:46 RET drogue deployment
Onboard tape
- 265:08:48 Duke (onboard): ... Set. Tape is running. Standing by for 289:58 [265:11], Separation Checklist.
- ...
- 265:16:32 Mattingly (onboard): Pro.
- 265:16:36 Young (onboard): 7.62g's.
- 265:16:37 Mattingly (onboard): Oh, shoot.
- 265:16:38 Duke (onboard): This says 7.1 on the pad.
- 265:16:39 Young (onboard): 36188.
- 265:16:41 Duke (onboard): Okay, this says 36196.
- 265:16:44 Young (onboard): Minus 6.68.
- 265:16:46 Duke (onboard): This says 6.54.
- 265:16:47 Young (onboard): Okay.
- ...
- 265:22:32 Duke (onboard): Separate. There we go.
- ...
- 265:30:04 Duke (onboard): Seven g's.
- 265:30:07 Mattingly (onboard): (Laughter) It's going to feel it.
- 265:30:08 Young (onboard): It's gonna hurt. It really is, I bet you.
- 265:30:14 Mattingly (onboard): Yep.
- ...
265:37:03 Duke (onboard): Thirty seconds to RRT. RET?
- 265:37:14 Mattingly (onboard): And call at RRT.
- 265:37:17 Duke (onboard): Okay; 15 seconds.
- ...
- 265:37:44 Duke (onboard): Okay, we got some - glow ...
- ...
- 265:37:59 Duke (onboard): .05g -
- ...
- 265:38:02 Mattingly (onboard): Okay, EMS and .05g Roll
- 265:38:07 Young (onboard): Okay, 0.12g's ...
- 265:38:08 Mattingly (onboard): Beautiful.
- 265:38:09 Young (onboard): 0.17, 0.24, 0.34.
- 265:38:14 Mattingly (onboard): Okay.
- 265:38:15 Young (onboard): 0.5; okay, 0.7.
- 265:38:32 Duke (onboard): That's just 2?
- 265:38:33 Mattingly (onboard): No, that's 4.
- 265:38:34 Young (onboard): 4.
- 265:38:38 Mattingly/Young (onboard): 5.
- 265:38:40 Mattingly (onboard): Right on. There's 6.
- 265:38:42 Duke (onboard): 6.
- 265:38:48 Young (onboard): 6.9; 7.
- 265:38:54 Mattingly (onboard): It's easing off.
- 265:38:57 Young (onboard): 7. Comp for roll.
- 265:38:59 Mattingly (onboard): Good.
- 265:39:00 Young (onboard): Plus 53.
- 265:39:01 Mattingly (onboard): Circle it.
- 265:39:02 Young (onboard): Plus 90.
- 265:39:03 Mattingly (onboard): Good.
- 265:39:04 Young (onboard): Plus 164.
- 265:39:05 Mattingly (onboard): Outstanding.
- 265:39:06 Crew (onboard): [Garble].
- 265:39:08 Mattingly (onboard): Doing good work; 5g's.
- 265:39:11 Young (onboard): 5g's; 4.9.
- 265:39:14 Mattingly (onboard): Outstanding machine! Something's on my window.
- 265:39:20 Young (onboard): Guess that's Mylar over there.
- 265:39:21 Duke (onboard): Mylar.
- 265:39:23 Mattingly (onboard): 4g's; DO .
- 265:39:24 Young (onboard): Plus 190, plus 87 -
- 265:39:28:Young (onboard): Plus 53.
- 265:39:34 Young (onboard): Okay, we're subcirc.
- 265:39:39 Young (onboard): Comp for plus one.
- 265:39:42 Duke (onboard): And roll.
- 265:40:49 Young (onboard): Minus 86 ...
- 265:40:51 Young (onboard): Minus 84.
- 265:40:53 Mattingly (onboard): It's gonna pull another 4g's here pretty soon.
- 265:40:58 Young (onboard): Minus 80.
- 265:41:02 Young (onboard): Minus 77; minus 76 -
- 265:41:06 Duke (onboard): Okay, we [garble] blackout right on time.
- 265:41:09 Duke (onboard): Got signal strength.
- 265:41:10 Young (onboard): Houston, we're out of the first blackout there.
- 265:41:59 Mattingly (onboard): Coming up on 3.
- ...
- 265:44:14 Young (onboard): Okay, we're through 90K.
- 265:44:42 Mattingly (onboard): Mark; 50K.
- 265:44:57 Mattingly (onboard): 40K.
- 265:45:07 Mattingly (onboard): At 35K,
- 265:45:14 Mattingly (onboard): 30K
- 265:45:27 Duke (onboard): The apex cover.
- 265:45:28:Crew (onboard): There go the drogues.
- 265:46:17 Duke (onboard): There they go. There go the mains...
- 265:48:03 Mattingly (onboard): Okay, we're coming through 5500, Charlie.
- 265:49:17 Mattingly (onboard): all right; 3200.
- 265:49:59 Mattingly (onboard): Okay, there's 2000
- 265:50:35 Mattingly (onboard): There's 1000.
- 265:50:56 Young: Okay. The purge burn has been accomplished.
- 265:51:07 Young: Splashdown.
Apollo 17 Mission report page 190, no trajectory data (useless)
Entry energy
Without the service module providing air, electricity, and cooling, the command module could not survive a big skip far above the atmosphere, though it did make a small skip to adjust the splashdown range (and Apollo 11 made a slightly larger skip to pass over a storm). The first skip lowered capsule velocity below Vcirc
So, the Apollo skip did not allow a higher speed Vinf, but a larger skip might be permitted for a Mars mission with hours of consumables onboard for the crew. That would allow a two pass entry trajectory with a first skip exit above Vcirc but significantly less than Vesc.
At 40 km altitude (6420 km radius equatorial), Vcirc = 7.88 km/s, so V²circ = 62.1 km²/s². For a LEO/MEO mission with a Vinf less than 8.7 km/s (such as AS-202 in the table below), V² is less than 76.0 km²/s², and less than 14 km²/s² of V² must be shed for a circular trajectory. On the other hand, for a lunar entry trajectory with a Vinf of up to 11.27 km/s, incoming V² can be as high as 127 km²/s², so 65 km²/s² must be shed during a lunar re-entry. For a flat trajectory, V² = 2 a d, so if d is limited then a acceleration must increase, as much as 4.6 times.
Apollo (and some Mars probe missions) use the drag and capsule L/D ≈ 0.3 to create negative (downward) lift, which curves the trajectory downwards and increases the path-length d. Otherwise, the shallow hyperbolic curve would only briefly touch the dense atmosphere long enough to provide significant acceleration.
As late as 1963, it was assumed that capsule L/D might range between 0.5 and 2.0, which would have significantly improved drag. Wind tunnel testing (at speeds far below Apollo entry) suggested an L/D of 0.37, while flight test showed an 18% reduction to 0.3 or less. The space shuttle had an L/D of only 1.0, very small compared to the Concorde ( L/D = 7 at Mach 2) or the Boeing 777 ( L/D = 19 ) or a thermal-soaring glider ( L/D = 70 ). Wider wings creating more lift would be torn off by reentry forces.
Ref: "The Dynamics and Flight Environment of Lifting Vehicles Entering the Atmospheres of Earth, Mars, and Venus", Phillip Levine (Avco, MA), pp. 349-375 in Dynamics of Manned Lifting Planetary Entry, Wiley, 1963
Apollo Related Missions
At 40 km altitude (6420 km radius equatorial), Vcirc = 7.88 km/s and V²circ = 62.1 km²/s² . Without the cm
NASA SP-4009 The Apollo Spacecraft - A Chronology
P = NASA Post-launch Report |
C = |
Launch |
Mission |
|
rocket |
perigee |
apogee |
entry |
max |
L/D |
heat |
error |
|
|
|
|
|
km |
km |
km/s |
gees |
|
MW/m² |
km |
|
05/28/64 |
S1 |
182 |
227 |
decay June 1, 1964 |
|||||||
09/18/64 |
S1 |
177 |
206 |
decay September 22, 1964 |
|||||||
02/16/65 |
S1 |
500 |
736 |
decay July 10, 1985 |
|||||||
05/25/65 |
S1 |
511 |
739 |
decay July 8, 1989 |
|||||||
07/30/65 |
S1 |
521 |
536 |
decay August 4, 1969 |
|||||||
02/26/66 |
S1B |
|
425 |
8300 |
|
|
|
72 |
|||
07/05/66 |
S1B |
184 |
214 |
exploded in orbit |
|||||||
08/25/66 |
S1B |
|
1143 |
8690 |
|
|
|
380 |
|||
11/09/67 |
S5 |
204 |
18092 |
11139 |
7.3 |
|
|
16 |
Lift down 22 sec |
||
01/22/68 |
S1B |
162 |
214 |
decay February 12. 1968 |
|||||||
04/04/68 |
S5 |
32 |
22225 |
10000 |
3rd stage partial fail |
80 |
|||||
10/11/68 |
S1B |
227 |
301 |
7911 |
3.33 |
|
|
3.5 |
|||
12/21/68 |
S5 |
lunar |
11065 |
6.84 |
0.300 |
297 |
2.6 |
||||
03/03/69 |
S5 |
204 |
497 |
7921 |
3.35 |
|
|
5.0 |
|||
05/18/69 |
S5 |
lunar |
11094 |
6.78 |
0.305 |
292 |
2.4 |
||||
07/16/69 |
S5 |
lunar |
11032 |
6.56 |
0.300 |
301 |
3.1 |
||||
11/14/69 |
S5 |
lunar |
11008 |
6.57 |
0.309 |
298 |
3.7 |
||||
04/11/70 |
S5 |
lunar |
11037 |
5.56 |
0.291 |
292 |
1.9 |
||||
01/31/71 |
S5 |
lunar |
11025 |
6.76 |
0.280 |
308 |
1.1 |
||||
07/26/71 |
S5 |
lunar |
11267 |
6.23 |
0.290 |
294 |
1.9 |
||||
04/16/72 |
S5 |
lunar |
11033 |
7.19 |
0.286 |
317 |
5.6 |
||||
12/07/72 |
S5 |
lunar |
11000 |
6.49 |
0.290 |
317 |
1.9 |
||||

