|
Size: 806
Comment:
|
Size: 5727
Comment:
|
| Deletions are marked like this. | Additions are marked like this. |
| Line 6: | Line 6: |
| Useful graphs for Apollo 8, 10, and 11. I cannot find useful entry information after Apollo 11, so these three sets are hopefully representative of the other six lunar missions. == Click pictures for enlargements == ------- |
|
| Line 9: | Line 13: |
| . Entry at 400 kft (122 km) at 146:46:12.8 | . Entry at 400 kft (122 km) at 146:46:12.8 . velocity 36 221 ft/s ( 11 040 m/s) . flight path angle -6.50 degrees, ( 0.114 slope ) . maximum velocity 36 303 ( 11 065 m/s ) . maximum acceleration 6.84 gees |
| Line 11: | Line 20: |
| ==== Roll ==== {{attachment:a8r.png}} ==== Entry Monitor System Scroll ==== {{attachment:a8a.png}} {{attachment:a8b.png}} |
=== Entry Monitor System Scroll, Gees vs Velocity === [[ attachment:a8a.png | {{attachment:a8a.png | | width=400}} ]] [[ attachment:a8b.png | {{attachment:a8b.png | | width=280}} ]] === Roll vs Mission Elapsed Time === [[ attachment:a8r.png | {{attachment:a8r.png | | width=400}} ]] ------- |
| Line 17: | Line 29: |
| . [[ https://www.hq.nasa.gov/alsj/a410/A10_MissionReport.pdf | Mission report ]] . page 6-13, 54/323 TABLE 6-VI I . - ENTRY TRAJECTORY PARAMETERS . Entry at 400 kft (122 km) at 191:48:54.5 . velocity 36 314 ft/sec (11 068 m/s) . flight-path angle -6.54 degrees ( slope 0.115 ) . maximum velocity 36 397 ft/s ( 11 094 m/s) . maximum acceleration 6.78 gees . [[ http://history.nasa.gov/ap10fj/pdf/19730064165_a10mr-supp10-entry-postflight-analysis.pdf | Entry Postflight Analysis ]] === Entry Monitor System Scroll, Gees vs velocity === [[ attachment:a10ems.png | {{attachment:a10ems.png | | width=800 }} ]] === Roll and Altitude vs Ground Elapsed Time === [[ attachment:a10roll.png | {{ attachment:a10roll.png | | width=350 }} ]] [[ attachment:a10alt.png | {{ attachment:a10alt.png | | width=350 }} ]] === Gees and Lift/Drag vs Ground Elapsed Time === [[ attachment:a10gee.png | {{ attachment:a10gee.png | | width=350 }} ]] [[ attachment:a10LD.png | {{ attachment:a10LD.png | | width=350 }} ]] === Range and Vertical Velocity vs Ground Elapsed Time === [[ attachment:a10range.png | {{attachment:a10range.png | | width=350 }} ]] [[ attachment:a10rdot.png | {{attachment:a10rdot.png | | width=350 }} ]] ------- |
|
| Line 18: | Line 56: |
| . [[ https://www.hq.nasa.gov/alsj/a11/A11_MissionReport.pdf | Mission report ]] . page 7-12 120/359 TABLE 7-VI I . - ENTRY TRAJECTORY PARAMETERS . Entry at 400 kft (122 km) at 195:03:05.7 . velocity 36 194.4 ft/sec (11 032 m/s) . flight-path angle -6.48 degrees ( slope 0.114 ) . maximum velocity 36 227.4 ft/s ( 11 042 m/s) . maximum acceleration 6.51 gees . [[ https://history.nasa.gov/ap11fj/pdf/19740072963_as11-entry-analysis-19700220.pdf | Entry Postflight Analysis ]] . 1st maximum load factor 6.73g 31,810ft/s . 1st minimum load factor 0.48g 20,500ft/s . 2nd maximum load factor 6.00g 12,390ft/s == Table III == ||EI time|| Load g|| V f/s ||range n mi|| ° Bank ||Rdot f/s|| || 0:00 || 0.000 || 36190 || 1593 || || || || 0:28 || 0.049 || 36276 || 1418 || || || || 0:30 || || 36277 || || 0.0 || -3186 || || 1:18 || || || || || -666 || || 1:30 || || 30176 || || 54.43 || 211 || || 1:56 || 1.057 || 22091 || || -86.68 || || === Entry Monitor System Scroll, Gees vs Velocity === [[ attachment:a11ems.png | {{ attachment:a11ems.png | | width=800 }} ]] === Roll and Altitude vs Time from Entry Interface === [[ attachment:a11roll.png | {{ attachment:a11roll.png | | width=440 }} ]] [[ attachment:a11alt.png | {{ attachment:a11alt.png | | width=260 }} ]] === Gees vs Time from Entry Interface and Lift/Drag vs Mach Number (velocity) === [[ attachment:a11gee.png | {{ attachment:a11gee.png | | width=300 }} ]] [[ attachment:a11LD.png | {{ attachment:a11LD.png | | width=400 }} ]] === Range and Vertical Velocity vs Time from Entry Interface === [[ attachment:a11range.png | {{ attachment:a11range.png | | width=290 }} ]] [[ attachment:a11RDOT.png | {{ attachment:a11RDOT.png | | width=410 }} ]] === Velocity vs Time from Entry Interface === [[ attachment:a11vel.png | {{ attachment:a11vel.png | | width=400 }} ]] ------- |
|
| Line 19: | Line 97: |
| == Apollo 13 == == Apollo 14 == == Apollo 15 == == Apollo 16 == == Apollo 17 == |
. [[ https://www.hq.nasa.gov/alsj/a12/A12_MissionReport.pdf | Mission report ]] . page 5-14 96/310 TABLE 5-IX . - ENTRY TRAJECTORY PARAMETERS . Entry at 400 kft (122 km) at 244:22:19.1 . velocity 36 116 ft/sec (11 008 m/s) . flight-path angle -6.48 degrees ( slope 0.108 ) ------- '''~+ Apollo 13 +~''' [[ https://www.hq.nasa.gov/alsj/a13/A13_MissionReport.pdf | Mission report ]] page 9-17, two brief paragraphs about entry and landing (useless) '''~+ Apollo 14 +~''' [[ https://www.hq.nasa.gov/alsj/a14/A14MRntrs.pdf | Mission report ]] page 5-28, two brief paragraphs about entry and landing (useless) '''~+ Apollo 15 +~''' [[ https://www.hq.nasa.gov/alsj/a15/ap15mr.pdf | Mission report ]] page 114, two brief paragraphs about entry and landing (useless) '''~+ Apollo 16 +~''' [[ https://www.hq.nasa.gov/alsj/a16/A16_MissionReport.pdf | Mission report ]] page 9-56, "entry deceleration exceeded 7 gees" (semi-useless) '''~+ Apollo 17 +~''' [[ https://www.hq.nasa.gov/alsj/a17/A17_MissionReport.pdf | Mission report ]] page 190, no trajectory data (useless) |
Apollo Entry
From Apollo mission reports here
Apollo 7 and 9 were earth orbit, slower reentry. Apollo 8 and 10 through 17 were lunar missions with high speed reentry of the command module. Apollo 11,12, and 14-17 were landing missions.
Useful graphs for Apollo 8, 10, and 11. I cannot find useful entry information after Apollo 11, so these three sets are hopefully representative of the other six lunar missions.
Click pictures for enlargements
Apollo 8
- page 5-10, 53/252 TABLE 5-V . - ENTRY TRAJECTORY PARAMETERS
- Entry at 400 kft (122 km) at 146:46:12.8
- velocity 36 221 ft/s ( 11 040 m/s)
- flight path angle -6.50 degrees, ( 0.114 slope )
- maximum velocity 36 303 ( 11 065 m/s )
- maximum acceleration 6.84 gees
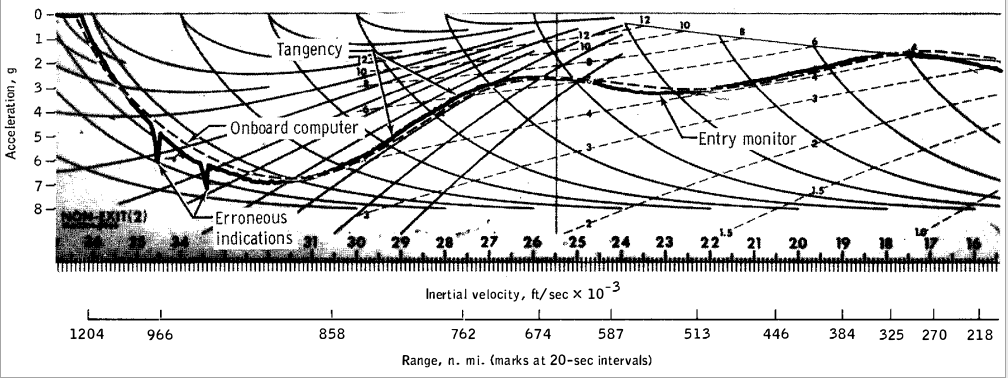
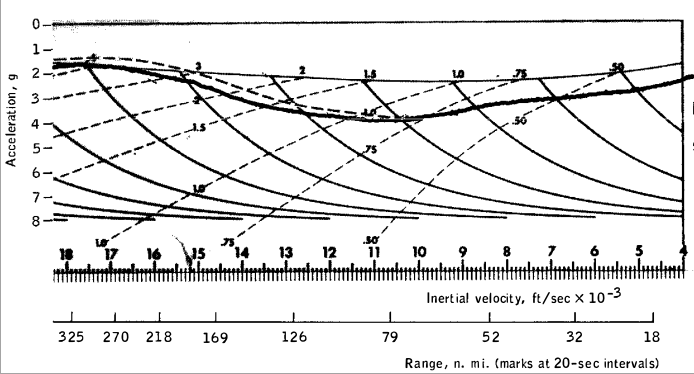
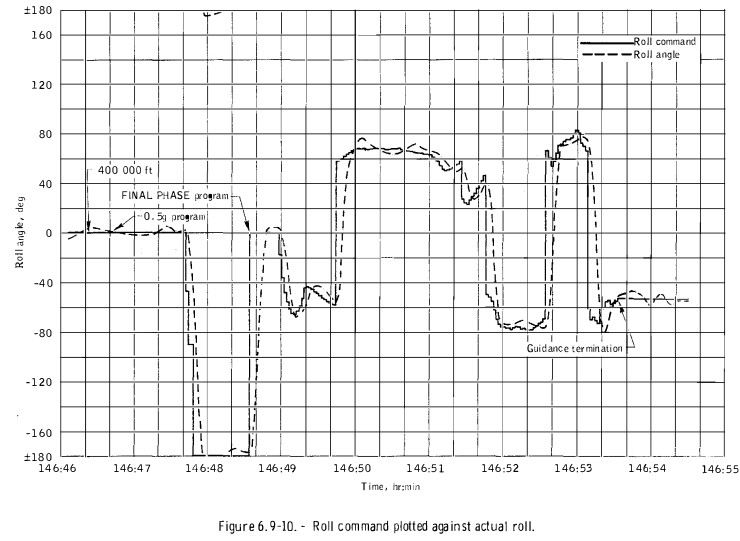
- page 6-67 to 6-69 entry graphs
Entry Monitor System Scroll, Gees vs Velocity
Roll vs Mission Elapsed Time
Apollo 10
- page 6-13, 54/323 TABLE 6-VI I . - ENTRY TRAJECTORY PARAMETERS
- Entry at 400 kft (122 km) at 191:48:54.5
- velocity 36 314 ft/sec (11 068 m/s)
- flight-path angle -6.54 degrees ( slope 0.115 )
- maximum velocity 36 397 ft/s ( 11 094 m/s)
- maximum acceleration 6.78 gees
Entry Monitor System Scroll, Gees vs velocity
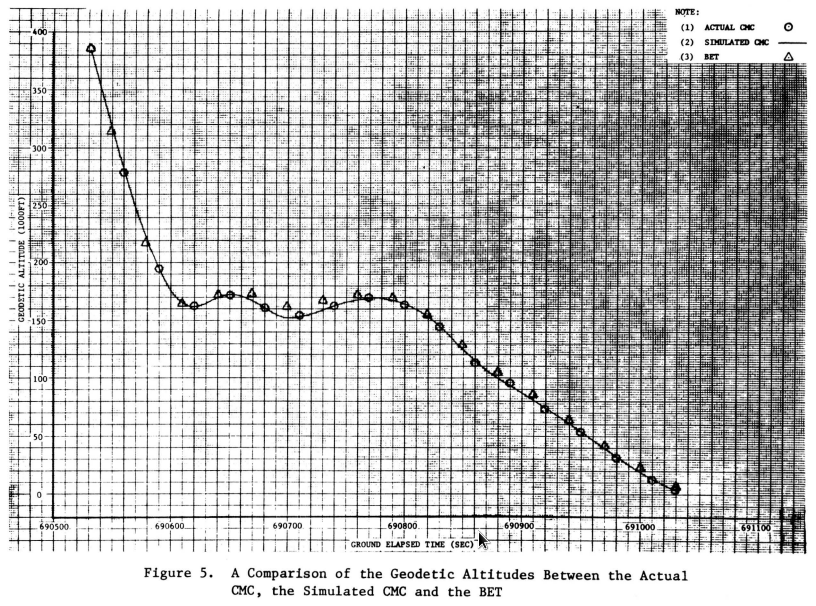
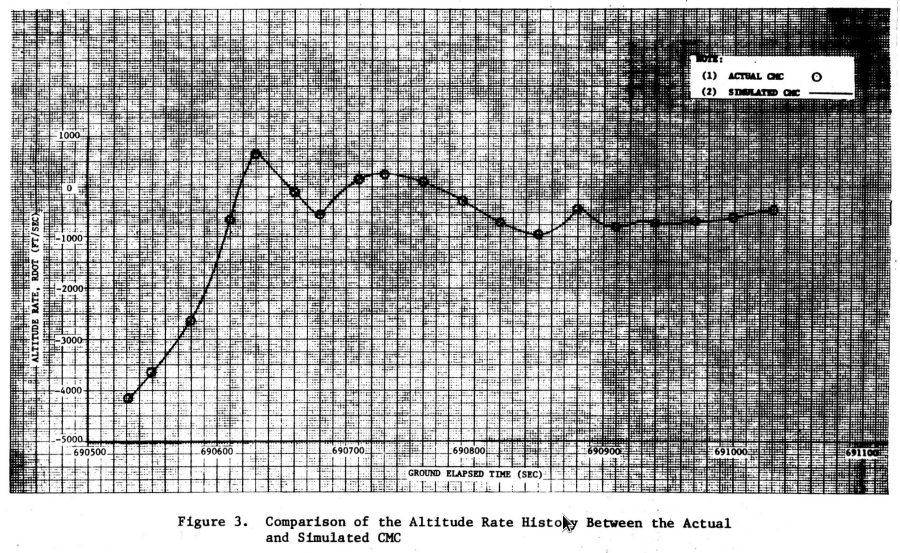
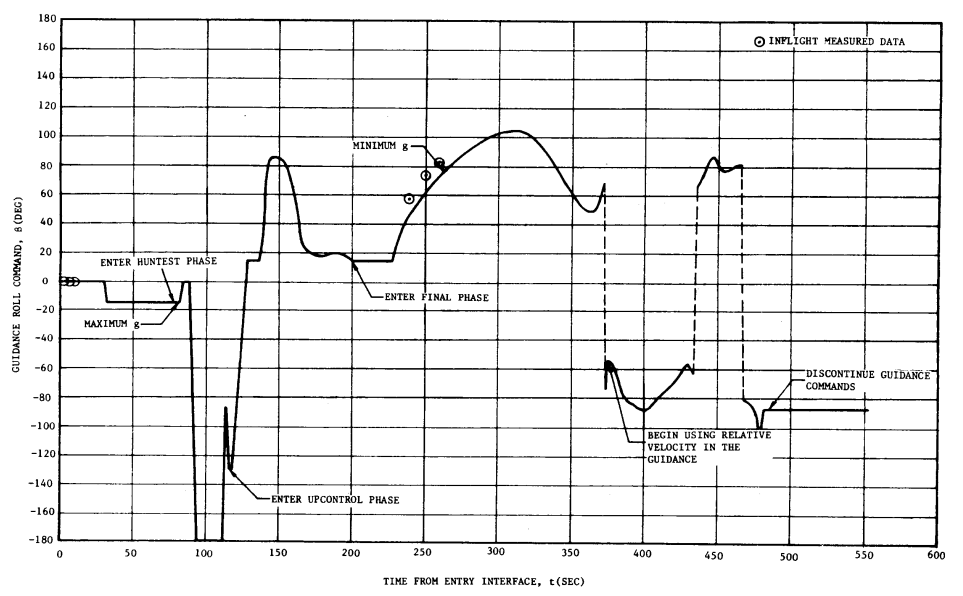
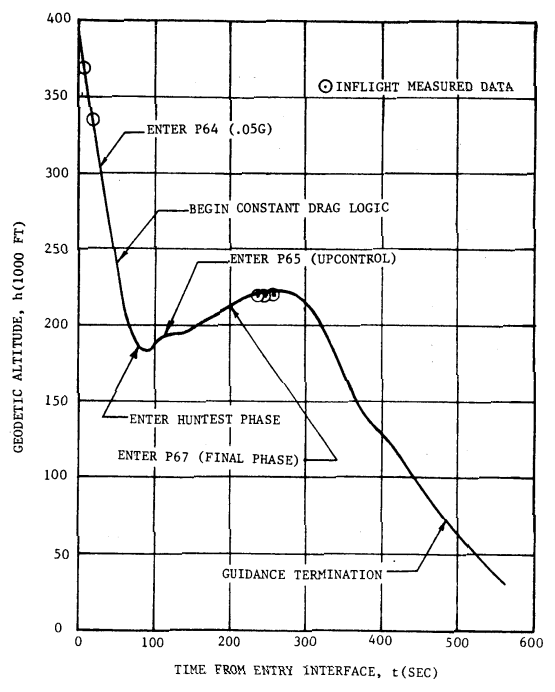
Roll and Altitude vs Ground Elapsed Time
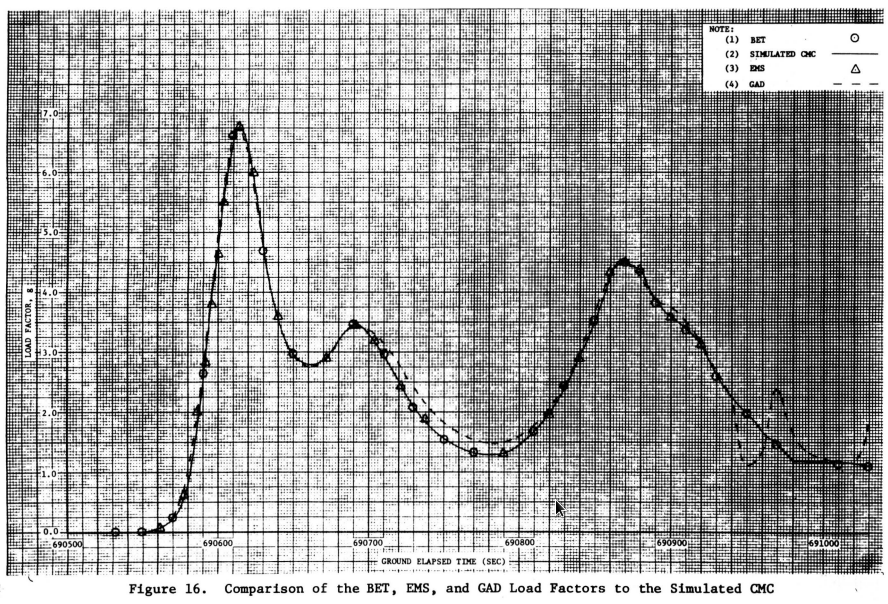
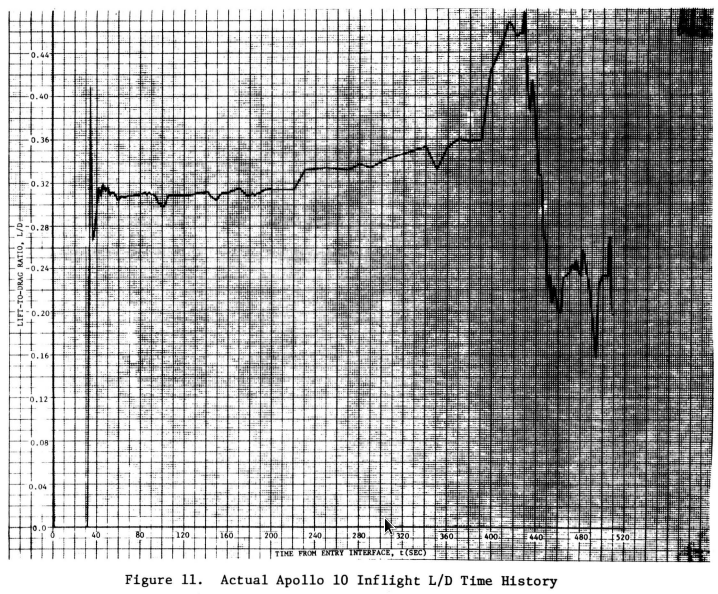
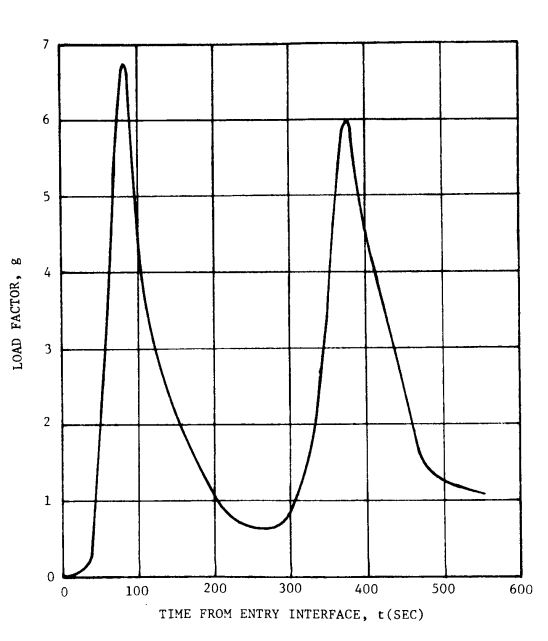
Gees and Lift/Drag vs Ground Elapsed Time
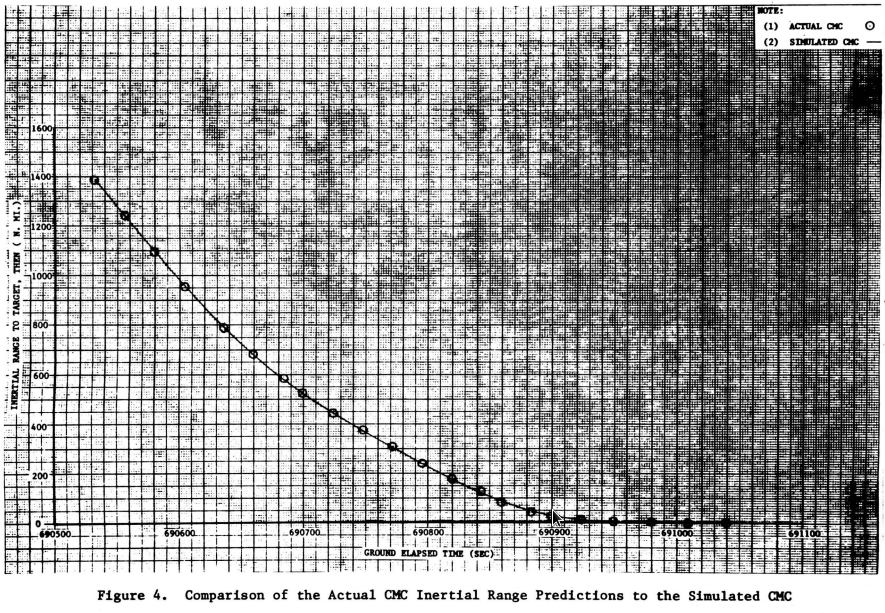
Range and Vertical Velocity vs Ground Elapsed Time
Apollo 11
- page 7-12 120/359 TABLE 7-VI I . - ENTRY TRAJECTORY PARAMETERS
- Entry at 400 kft (122 km) at 195:03:05.7
- velocity 36 194.4 ft/sec (11 032 m/s)
- flight-path angle -6.48 degrees ( slope 0.114 )
- maximum velocity 36 227.4 ft/s ( 11 042 m/s)
- maximum acceleration 6.51 gees
- 1st maximum load factor 6.73g 31,810ft/s
- 1st minimum load factor 0.48g 20,500ft/s
- 2nd maximum load factor 6.00g 12,390ft/s
Table III
EI time |
Load g |
V f/s |
range n mi |
° Bank |
Rdot f/s |
0:00 |
0.000 |
36190 |
1593 |
|
|
0:28 |
0.049 |
36276 |
1418 |
|
|
0:30 |
|
36277 |
|
0.0 |
-3186 |
1:18 |
|
|
|
|
-666 |
1:30 |
|
30176 |
|
54.43 |
211 |
1:56 |
1.057 |
22091 |
|
-86.68 |
|
Entry Monitor System Scroll, Gees vs Velocity
Roll and Altitude vs Time from Entry Interface
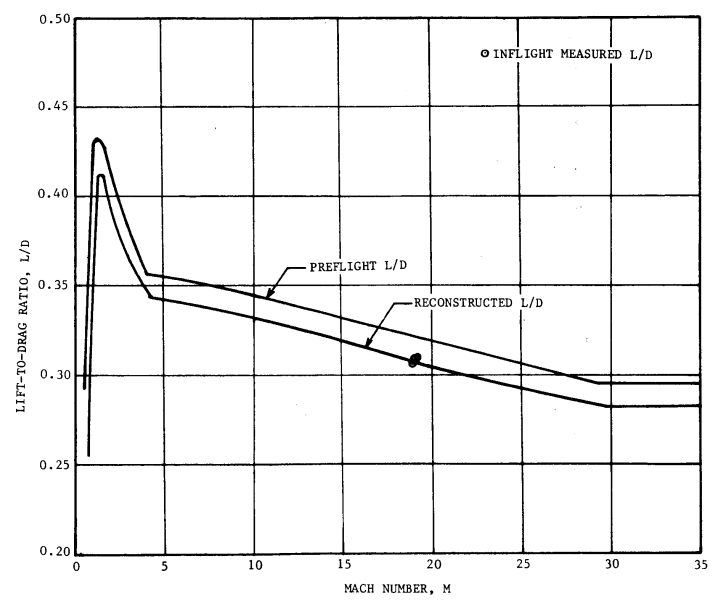
Gees vs Time from Entry Interface and Lift/Drag vs Mach Number (velocity)
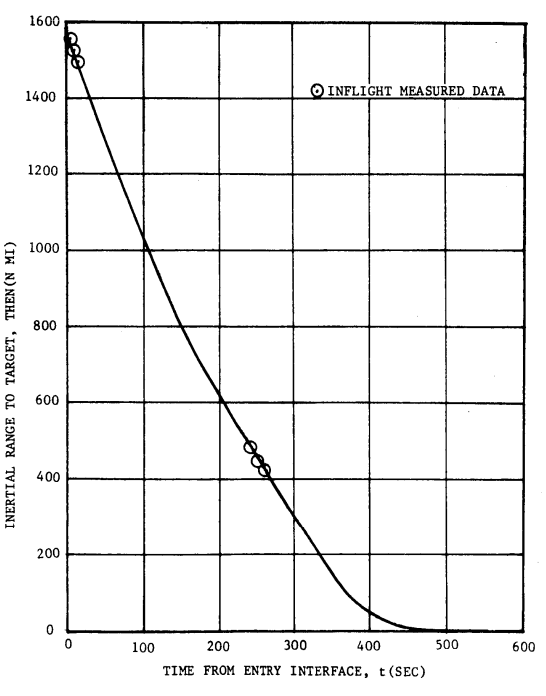
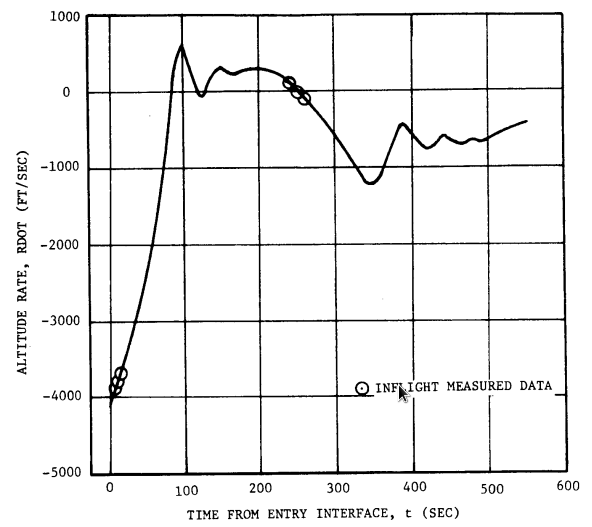
Range and Vertical Velocity vs Time from Entry Interface
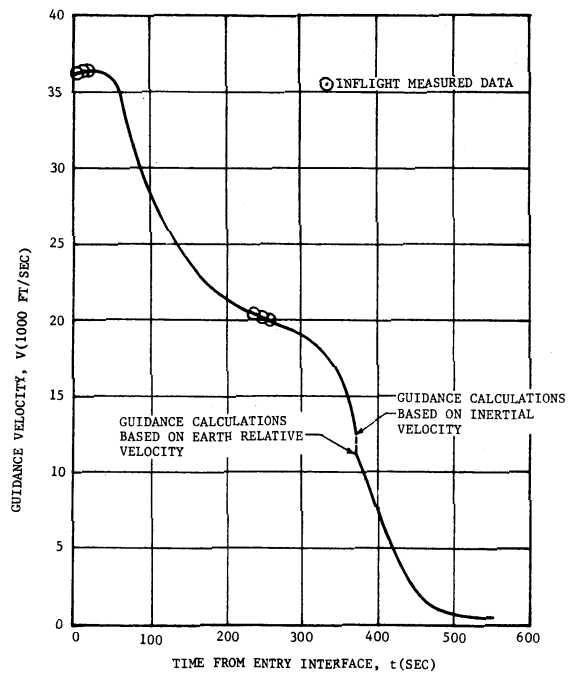
Velocity vs Time from Entry Interface
Apollo 12
- page 5-14 96/310 TABLE 5-IX . - ENTRY TRAJECTORY PARAMETERS
- Entry at 400 kft (122 km) at 244:22:19.1
- velocity 36 116 ft/sec (11 008 m/s)
- flight-path angle -6.48 degrees ( slope 0.108 )
Apollo 13 Mission report page 9-17, two brief paragraphs about entry and landing (useless)
Apollo 14 Mission report page 5-28, two brief paragraphs about entry and landing (useless)
Apollo 15 Mission report page 114, two brief paragraphs about entry and landing (useless)
Apollo 16 Mission report page 9-56, "entry deceleration exceeded 7 gees" (semi-useless)
Apollo 17 Mission report page 190, no trajectory data (useless)

