|
Size: 2443
Comment:
|
← Revision 52 as of 2020-08-28 17:21:33 ⇥
Size: 2615
Comment:
|
| Deletions are marked like this. | Additions are marked like this. |
| Line 7: | Line 7: |
| ||<|14> {{ attachment:geocoronaMarkup.png | | width=600 }} ||<)> '''alt km''' ||<)> '''radius km''' ||<)> '''#/m3''' || | ||<|16> {{ attachment:geocoronaMarkup.png | | width=600 }} ||<)> '''alt km''' ||<)> '''radius km''' ||<)> '''#/m3''' || |
| Line 9: | Line 9: |
| ||<)> 2000 ||<)> 8378 ||<)> 12000e6 || Constr. perigee || | ||<)> 2000 ||<)> 8378 ||<)> 12000e6 || [[ HighApogeeConstruction | Construction perigee ]] || |
| Line 18: | Line 18: |
| ||<)> 69572 ||<)> 75950 ||<)> 11e6 || Constr. apogee || | ||<)> 69572 ||<)> 75950 ||<)> 11e6 || [[ HighApogeeConstruction | Construction apogee ]] || |
| Line 21: | Line 21: |
| Line 24: | Line 24: |
||<-10> Estimated hydrogen mass per 1000 km height, 1.67e-27kg/H || |
||<-12> Estimated hydrogen mass per 1000 km height, 1.67e-27kg/H || |
| Line 29: | Line 28: |
| || #H / m³ || 2.1e10 || 1.2e10 || 3.1e9 || 8.2e8 || 1.8e8 || 6.7e7 || 4.5e7 || 3.5e7 || 1.4e7 || 1.1e7 || 1.0e7 || || H kg || 24000 || 32000 || 18000 || 12000 || 5100 || 2500* || 2300 || 2300 || 1300 || 1300* || 1200 || |
|| #H / m³ || 2.1e10 || 1.2e10 || 8.2e8 || 1.8e8 || 6.7e7 || 4.5e7 || 3.5e7 || 2.2e7 || 1.4e7 || 1.1e7 || 1.0e7 || || H kg || 240000 || 32000 || 4700 || 2600 || 1900 || 1700* || 1000 || 1500 || 1300 || 1300* || 1200 || Less than 20 tonnes of hydrogen (and almost nothing else) above GEO, out to the bow shock. |
| Line 51: | Line 52: |
----- |
Propellant Plume Gas Scattering
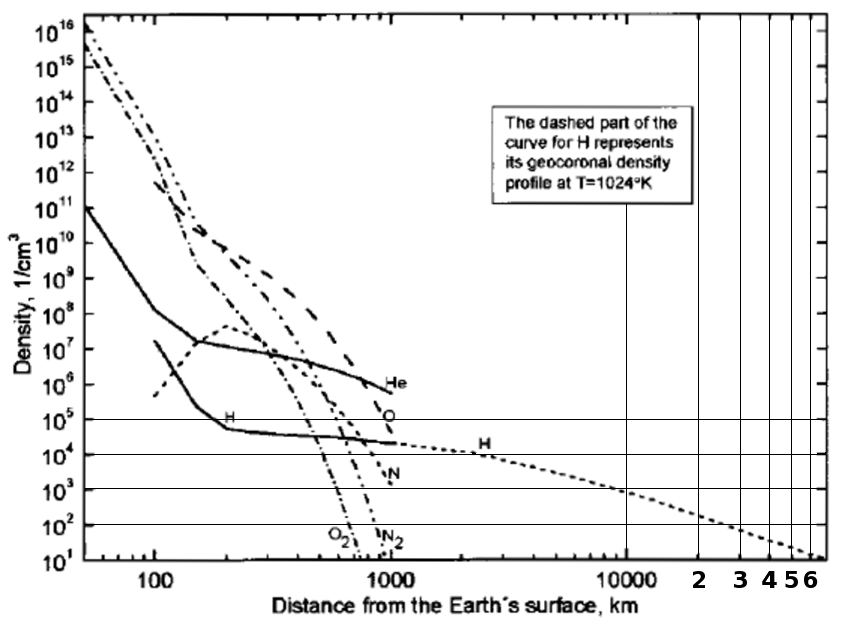
H density versus altitude
|
alt km |
radius km |
#/m3 |
1000 |
7378 |
21000e6 |
|
2000 |
8378 |
12000e6 |
|
5000 |
11378 |
3100e6 |
|
10000 |
16378 |
820e6 |
|
20000 |
26378 |
180e6 |
|
30000 |
36378 |
67e6 |
|
35786 |
42164 |
45e6 |
GEO circular |
40000 |
46378 |
35e6 |
|
50000 |
56378 |
22e6 |
|
60000 |
66378 |
14e6 |
|
69572 |
75950 |
11e6 |
|
70000 |
76378 |
10e6 |
|
. https://www.sciencedirect.com/science/article/pii/0022407372900052
Estimated hydrogen mass per 1000 km height, 1.67e-27kg/H |
|||||||||||
Altitude km |
1000 |
2000 |
10000 |
20000 |
30000 |
35786* |
40000 |
50000 |
60000 |
69572* |
70000 |
Radius km |
7378 |
11378 |
16378 |
26378 |
36378 |
42164* |
46378 |
56378 |
66378 |
75950* |
76378 |
Volume km³ |
6.8e11 |
1.6e12 |
3.4e12 |
8.7e12 |
1.7e13 |
2.2e13 |
2.7e13 |
4.0e13 |
5.5e13 |
7.2e13 |
7.3e13 |
#H / m³ |
2.1e10 |
1.2e10 |
8.2e8 |
1.8e8 |
6.7e7 |
4.5e7 |
3.5e7 |
2.2e7 |
1.4e7 |
1.1e7 |
1.0e7 |
H kg |
240000 |
32000 |
4700 |
2600 |
1900 |
1700* |
1000 |
1500 |
1300 |
1300* |
1200 |
Less than 20 tonnes of hydrogen (and almost nothing else) above GEO, out to the bow shock.
Collision cross section table
Gas |
(nm)² |
(nm)² with H₂ |
H₂ |
0.27 |
1.02 |
He |
0.21 |
0.99 |
Ar |
0.36 |
1.06 |
O₂ |
0.40 |
1.07 |
N₂ |
0.43 |
1.08 |
CH₄ |
0.46 |
1.09 |
CO₂ |
0.52 |
1.11 |
Cl₂ |
0.93 |
1.22 |
The second column is the combined collision cross section with an H₂ molecule ... the square of the sum of the square roots.
from libretexts
http://hitran.org . . . . . . . . . k*l at k*l dot com on kao3

